
Fig. 3
- ID
- ZDB-FIG-250512-85
- Publication
- Zhang et al., 2025 - Vitellogenin receptor mediates heat adaptability of oocyte development in mud crabs and zebrafish
- Other Figures
- All Figure Page
- Back to All Figure Page
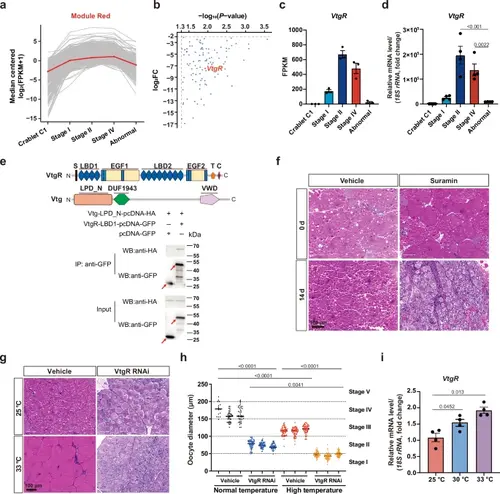
Deficiency in VtgR production leads to the formation of “abnormal” crabs.a Expression levels of genes from Module Red in the ovaries of normal mud crabs at different developmental stages and “abnormal” crabs. b The 101 genes from Module Red exhibit significantly downregulated expression in the ovaries of “abnormal” crabs compared to normal mud crabs at stage IV. Statistical significance was determined by the Ballgown parametric F-test. c RNA-seq based quantification of VtgR expression in the ovaries of normal mud crabs at different developmental stages and “abnormal” crabs (n = 3 crabs). d qPCR-based quantification of VtgR expression in the ovaries of normal mud crabs at different developmental stages and “abnormal” crabs. Relative gene expression was expressed as fold change compared to crabs at crablet stage C1 (n = 4 crabs). Statistical significance was determined by one-way ANOVA with Tukey’s test. e Co-IP assay confirming the interaction between the VtgR-LBD1 domain and the Vtg-LPD_N domain in mud crabs. The red arrowhead indicates the target band. Representative results from three independent experiments are shown. f Inhibition of VtgR-mediated endocytosis of Vtg in mud crabs using suramin. Representative results from three independent experiments are shown. g Histological analysis of ovaries from VtgR knockdown and control mud crabs maintained at normal (25 °C) and high (33 °C) temperatures. Representative results from three independent experiments are shown. h Oocyte diameter of different groups of mud crabs reared at 25 °C and 33 °C (n = 3 crabs). Horizontal black lines indicate the means. Statistical significance was determined by one-way ANOVA with Tukey’s test. i qPCR-based quantification of VtgR expression in the ovaries of normal mud crabs maintained at 25 °C, 30 °C, and 33 °C. Relative gene expression level was expressed as fold change compared to crabs maintained at 25 °C (n = 4 crabs). Statistical significance was determined by one-way ANOVA with Tukey’s test. Data are presented as the mean ± SEM. P values are indicated above the plots, with P < 0.05 considered statistically significant. Source data are provided as a Source Data file. |