
- Title
-
Vitellogenin receptor mediates heat adaptability of oocyte development in mud crabs and zebrafish
- Authors
- Zhang, L., Wu, K., Li, H., Zhan, M., Wang, S., Song, E., Zhang, Q., He, J., He, X., Xu, M., Deng, H., Su, Y., Liu, Z., Yan, Z., Tan, P., He, M., Weng, S., Ge, W., He, J., Wang, M.
- Source
- Full text @ Nat. Commun.
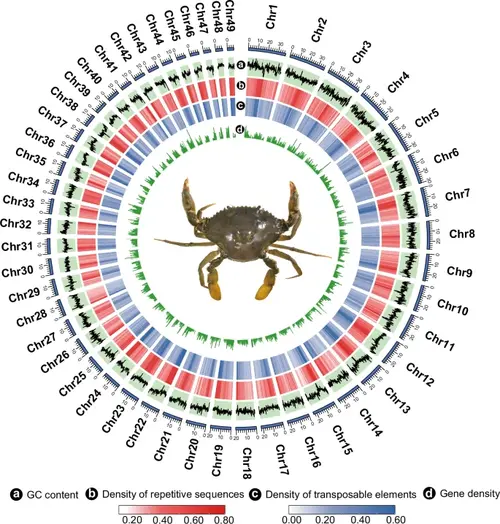
Genome assembly of S. paramamosain. Circos plot of the distribution of genomic elements in S. paramamosain. |
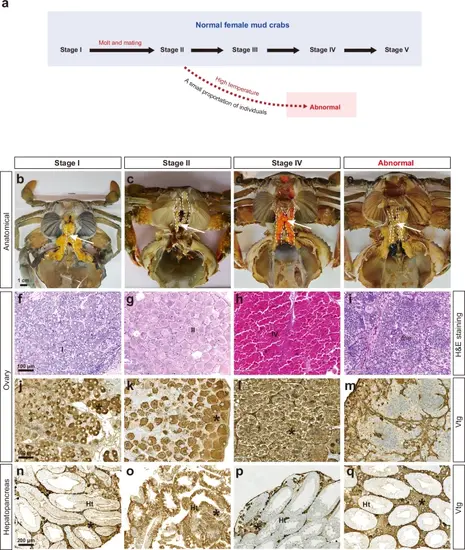
Phenotypic features of normal mud crabs at stage I, stage II, and stage IV as well as “abnormal” crabs. a Diagram illustrating the developmental processes of ovaries in normal female mud crabs and “abnormal” crabs. Normal female mud crabs undergo a terminal molt prior to mating, after which they engage in mating with males. This process includes the transition of oocytes from the oogonia stage to the previtellogenesis stage. However, a small proportion of female crabs exhibit a disruption in oogenesis post-mating, resulting in an inability of oocytes to absorb vitellogenin. b–e Images of the anatomical structures showing the overall morphology of mud crabs at different ovarian developmental stages. Ovaries are outlined with dotted lines and indicated by arrowheads. f–i The details of ovarian differentiation, including oocyte development, were revealed by Hematoxylin and eosin (H&E) staining. I, stage I oocyte (diameter 35-50 μm); II, stage II oocyte (diameter 45–100 μm); IV, stage IV oocyte (diameter 120-200 μm); me, meiotic cells. Representative results of three independent experiments were shown. j–m The ovary sections showed vitellogenin absorption in the oocytes, as detected by immunohistochemical staining (Vtg). Asterisk, vitellogenin. Representative results of three independent experiments were shown. n–q The sections of the hepatopancreas showing the vitellogenin production, as revealed by immunohistochemical staining (Vtg). Ht, hepatopancreatic tubules; asterisk, vitellogenin. Representative results of three independent experiments were shown. |
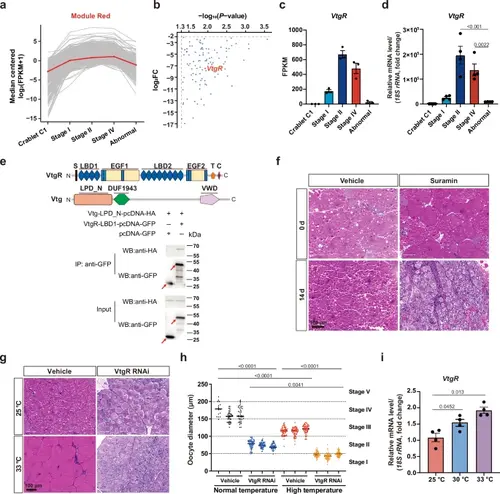
Deficiency in VtgR production leads to the formation of “abnormal” crabs.a Expression levels of genes from Module Red in the ovaries of normal mud crabs at different developmental stages and “abnormal” crabs. b The 101 genes from Module Red exhibit significantly downregulated expression in the ovaries of “abnormal” crabs compared to normal mud crabs at stage IV. Statistical significance was determined by the Ballgown parametric F-test. c RNA-seq based quantification of VtgR expression in the ovaries of normal mud crabs at different developmental stages and “abnormal” crabs (n = 3 crabs). d qPCR-based quantification of VtgR expression in the ovaries of normal mud crabs at different developmental stages and “abnormal” crabs. Relative gene expression was expressed as fold change compared to crabs at crablet stage C1 (n = 4 crabs). Statistical significance was determined by one-way ANOVA with Tukey’s test. e Co-IP assay confirming the interaction between the VtgR-LBD1 domain and the Vtg-LPD_N domain in mud crabs. The red arrowhead indicates the target band. Representative results from three independent experiments are shown. f Inhibition of VtgR-mediated endocytosis of Vtg in mud crabs using suramin. Representative results from three independent experiments are shown. g Histological analysis of ovaries from VtgR knockdown and control mud crabs maintained at normal (25 °C) and high (33 °C) temperatures. Representative results from three independent experiments are shown. h Oocyte diameter of different groups of mud crabs reared at 25 °C and 33 °C (n = 3 crabs). Horizontal black lines indicate the means. Statistical significance was determined by one-way ANOVA with Tukey’s test. i qPCR-based quantification of VtgR expression in the ovaries of normal mud crabs maintained at 25 °C, 30 °C, and 33 °C. Relative gene expression level was expressed as fold change compared to crabs maintained at 25 °C (n = 4 crabs). Statistical significance was determined by one-way ANOVA with Tukey’s test. Data are presented as the mean ± SEM. P values are indicated above the plots, with P < 0.05 considered statistically significant. Source data are provided as a Source Data file. |
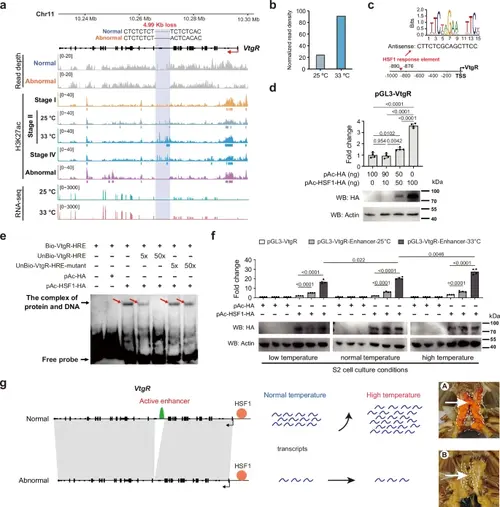
VtgR-mediated heat stress response mechanism of vitellogenic oocyte formation in mud crabs. a H3K27ac signal intensity in the VtgR gene and VtgR expression level in different groups of mud crabs. A 4.99 kb deletion in the nineteenth intron of VtgR removes an enhancer crucial for both vitellogenic oocyte formation and heat stress responsiveness in “abnormal” crabs. Horizontal bars below the H3K27ac signals indicate enriched regions identified by MACS2. b Normalized read density for the differential peak within the deletion in normal stage II mud crabs reared at 25 °C and 33 °C. c Schematic representation of the heat shock factor 1 (HSF1) binding site on the VtgR promoter. d Relative induction of VtgR promoter activity in Drosophila S2 cells transfected with HSF1 in a dosage-dependent manner, as assessed by dual luciferase assays (n = 4 wells). Statistical significance was determined by one-way ANOVA with Tukey’s test. Representative results from three independent experiments are shown. e Electrophoretic mobility shift assay (EMSA) demonstrating HSF1 binding to the VtgR promoter. Representative results from three independent experiments are shown. f Relative induction of VtgR promoter activity, with or without the VtgR-Enhancer-25°C or VtgR-Enhancer-33°C, mediated by expressed HSF1 in Drosophila S2 cells, as measured by dual luciferase assays (n = 4 wells). Protein expression levels were detected by Western blotting, with actin as a protein loading control. Statistical significance was determined by two-sided Student’s t-test. g A proposed scheme for the VtgR-mediated heat stress protection mechanism of vitellogenic oocyte formation in mud crabs. Bars represent the mean ± SD. P values are indicated above the plots, with P < 0.05 considered statistically significant. Source data are provided as a Source Data file. |
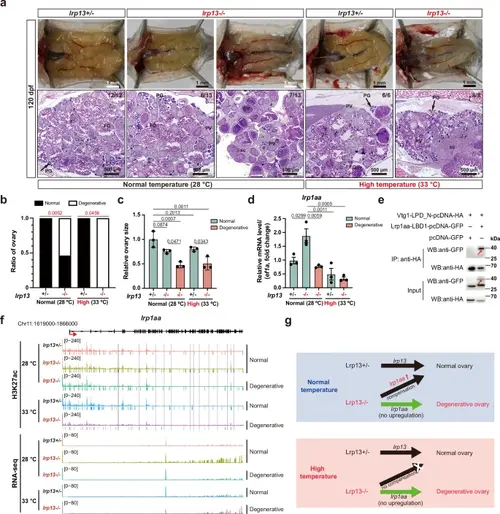
Lrp13 mediates the heat stress response mechanism of vitellogenic oocyte formation in zebrafish. a Gross anatomical appearance and histological analysis of lrp13-/- zebrafish mutants and heterozygous controls (+/-) at 120 days post-fertilization (dpf) under normal (28 °C) and high (33 °C) temperatures. PG, primary growth follicle; PV, previtellogenic follicle; EV, early vitellogenic follicle; FG, full-grown follicle; sc, stroma cells; Y, yolk. b Percentage of ovarian degeneration occurrence. Statistical significance was determined using two-sided Fisher’s exact test. c Relative ovary size in different groups of zebrafish (n = 3 fish). Bars represent the mean ± SD. Statistical significance was determined by one-way ANOVA with Tukey’s test. d qPCR-based quantification of lrp1aa expression levels in different groups of zebrafish (n = 3 fish). Relative gene expression level was expressed as fold change compared to lrp13 + /- heterozygous controls reared at 28 °C. Bars represent the mean ± SEM. Statistical significance was determined by one-way ANOVA with Tukey’s test. e Co-IP assay demonstrating the interaction between the Vtg1-LPD_N domain and the Lrp1aa-LBD1 domain in zebrafish. The red arrowhead indicates the target band. Representative results from three independent experiments are shown. f H3K27ac signal intensity in the lrp1aa gene and lrp1aa expression levels in different zebrafish groups. Horizontal bars below the signals indicate enriched regions identified by MACS2. H3K27ac peaks identified in lrp13-/- zebrafish mutants with normal ovaries reared at 28 °C, but absent in other groups, were indicated by gray rectangles. g Schematic illustrating the compensatory role of Lrp1aa in the absence of Lrp13 in zebrafish. Under normal conditions, Lrp13 primarily mediates Vtg absorption, while Lrp1aa compensates for its loss by upregulating expression. High temperatures suppress lrp1aa expression, whereas Lrp13 remains unaffected by heat stress, ensuring Vtg absorption and protecting vitellogenic oocyte formation under elevated temperatures. P values are indicated above the plots, with P < 0.05 considered statistically significant. Source data are provided as a Source Data file. |