FIGURE

Figure 7

ID
ZDB-FIG-250428-36
Publication
Petrovici et al., 2025 - Combined Neurotoxic Effects of Commercial Formulations of Pyrethroid (Deltamethrin) and Neonicotinoid (Imidacloprid) Pesticides on Adult Zebrafish (Danio rerio): Behavioral, Molecular, and Histopathological Analysis
Other Figures
All Figure Page
Back to All Figure Page
Figure 7

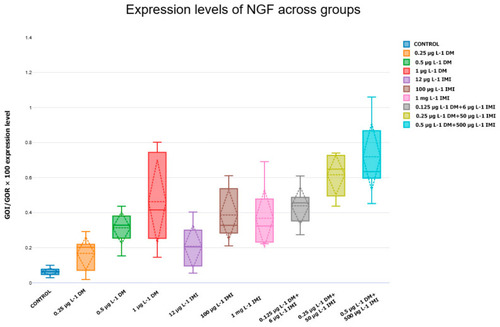
Expression levels of NGF across experimental groups—the relative expression levels of NGF in zebrafish exposed to different concentrations of DM, IMI, and their combinations (n = six per group). The y-axis indicates normalized gene expression (GOI/GOR × 100), while the x-axis represents the experimental groups. Each box plot displays the mean (horizontal discontinued line), median (horizontal continued line), interquartile range (box), and data variability (whiskers), with individual data points shown. Statistical analysis was performed using ANOVA followed by Tukey post hoc tests, with significance set at p < 0.05.

Expression Data

Expression Detail
Antibody Labeling
Phenotype Data

Phenotype Detail
Acknowledgments
This image is the copyrighted work of the attributed author or publisher, and ZFIN has permission only to display this image to its users. Additional permissions should be obtained from the applicable author or publisher of the image. Full text @ Life (Basel)