
Figure 2
- ID
- ZDB-FIG-250428-31
- Publication
- Petrovici et al., 2025 - Combined Neurotoxic Effects of Commercial Formulations of Pyrethroid (Deltamethrin) and Neonicotinoid (Imidacloprid) Pesticides on Adult Zebrafish (Danio rerio): Behavioral, Molecular, and Histopathological Analysis
- Other Figures
- All Figure Page
- Back to All Figure Page
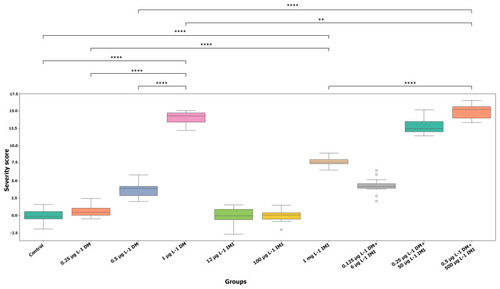
Behavioral severity across experimental groups with pairwise significance—box plot illustrating the distribution of behavioral severity scores across experimental groups. The y-axis represents the severity score, calculated as the total number of distinct behavioral abnormalities observed per group, while the x-axis denotes the different exposure conditions. Each box plot displays the median (horizontal line), interquartile range (box), and data variability (whiskers), with outliers represented as individual points. Statistical significance of pairwise comparisons between groups is indicated by horizontal brackets above the plot, with asterisks denoting significance levels ( |