
Fig. 3
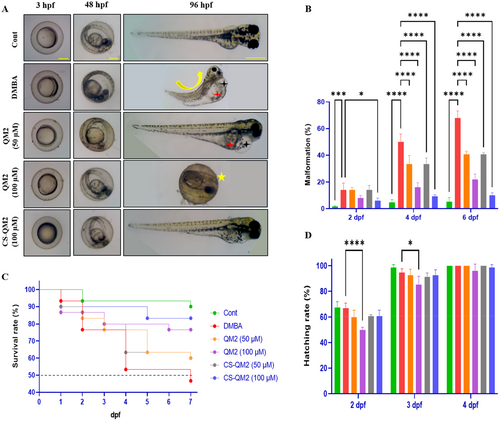
Effect of the QM2 compound and CS-QM2 nanoparticle on the DMBA induced malformations in zebrafish larvae. (A) Photomicrograph of developmental analysis on eleuthero embryos for 96 h. (B) Quantitative analysis of malformation rate. (C) Kaplan-Myers graph of zebrafish embryo survivability assay. (D) Hatching rate of zebrafish embryo. Data are presented as mean ± standard deviation of replicates. The asterix represents the statistical significance compared to the DMBA group. Black star – pericardial edema; Curve line – scoliosis; Red star – yolk sac edema; Yellow star – delayed hatching. Scale bar: 100 µm and 400 µm. |