
FIGURE
Fig. 2
Fig. 2
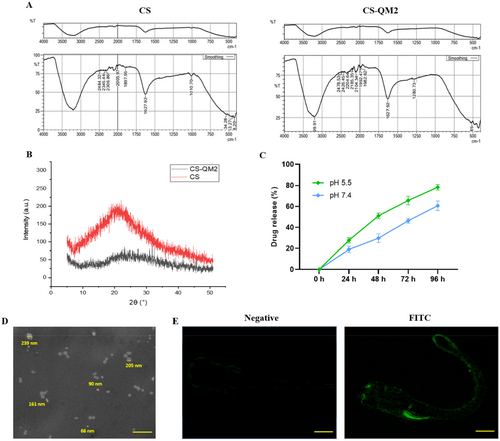
Characterization of CS-QM2 nanoparticle and its distribution in zebrafish larvae. (A) FTIR spectra of CS and CS-QM2 nanoparticles. (B) XRD patterns for CS and CS-QM2 nanoparticle. (C) Drug release efficiency of CS conjugate under acidic and physiological conditions. (D) SEM analysis of CS-QM2 nanoparticles produced by ionotropic gelation; scale bar: 1 µm (E) Distribution of FITC tagged CS-QM2 nanoparticle in zebrafish larvae; scale bar: 350 µm. |
Expression Data
Expression Detail
Antibody Labeling
Phenotype Data
Phenotype Detail
Acknowledgments
This image is the copyrighted work of the attributed author or publisher, and
ZFIN has permission only to display this image to its users.
Additional permissions should be obtained from the applicable author or publisher of the image.
Full text @ J. Biochem. Mol. Toxicol.