
FIGURE
Fig. 2
- ID
- ZDB-FIG-250422-112
- Publication
- Parobková et al., 2025 - Advancing microplastic detection in zebrafish with micro computed tomography: A novel approach to revealing microplastic distribution in organisms
- Other Figures
- All Figure Page
- Back to All Figure Page
Fig. 2
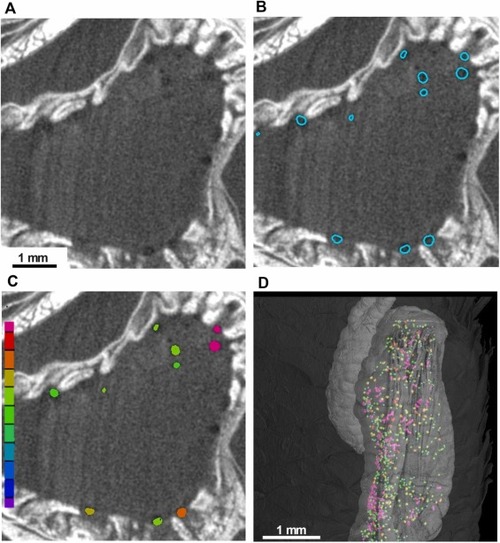
The process of segmentation and analysis of MPs. For visualisation purposes, the model zebrafish sample acquired using the Zebrafish Setup was utilized. The flow included: (A) data acquisition and rendering, (B) MP segmentation, (C) diameter quantification, and (D) 3D rendering of segmented particles color-labeled based on the determined diameter. |
Expression Data
Expression Detail
Antibody Labeling
Phenotype Data
Phenotype Detail
Acknowledgments
This image is the copyrighted work of the attributed author or publisher, and
ZFIN has permission only to display this image to its users.
Additional permissions should be obtained from the applicable author or publisher of the image.
Reprinted from Journal of hazardous materials, 488, Parobková, V., Maleček, L., Zemek, M., Kalčíková, G., Vykypělová, M., Buchtová, M., Adamovský, O., Zikmund, T., Kaiser, J., Advancing microplastic detection in zebrafish with micro computed tomography: A novel approach to revealing microplastic distribution in organisms, 137442137442, Copyright (2025) with permission from Elsevier. Full text @ J. Hazard. Mater.