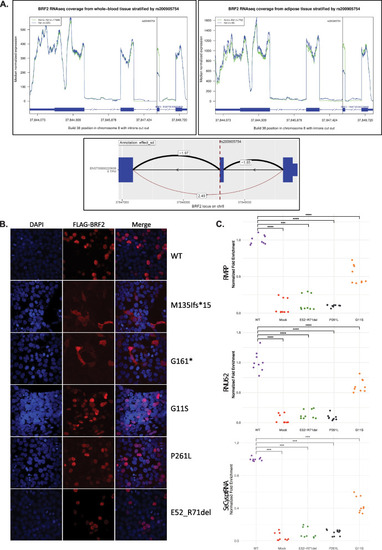
Variants assessments. A Effect on RNA expression of the splice donor variant BRF2(NM_018310.4):c.214 + 1G > A; p.(Glu52_Arg71del) (a.k.a. rs200905754). The median RNA-sequence coverage is reported for heterozygous (in blue) and noncarriers (in green) in blood (left top panel) and adipose tissue (right top panel). The splicing variant (dashed line in bottom panel) perturbs the correct splicing of exon 2 (black isoform, top cis-sQTL) and induces the skipping of that exon (red isoform: effect = 2.49 SD, P = 1.0 × 10−444). The splice junction usage quantification was calculated in terms of PSI (white labels). The dark blue squares represent exons of selected BRF2 transcripts which matched exon–intron boundary of the splice junctions. B Subcellular localization of FLAG-BRF2. Immunofluorescent staining with DAPI (blue) is shown on the left, FLAG-BRF2 (red) in the middle and the merged signals on the right. C ChIP-qPCR normalized fold enrichment analysis of RMRP, RNU6-2, and SeCys ptRNA loci occupancy by N-terminal FLAG-tagged BRF2. Comparison of FLAG-tagged BRF2 wild-type (WT) and mutants (FLAG-BRF2E52−R71del, FLAG-BRF2G11S, and FLAG-BRF2.P261L) HEK293T transfected cells with mock-treated cells. The statistical significance of pairwise comparisons between conditions was determined using the Wilcoxon rank-sum test, and significant differences are indicated with p-value annotations. ****p ≤ 0.0001; ***p ≤ 0.001
|
