FIGURE SUMMARY
Title

Bi-allelic variants in BRF2 are associated with perinatal death and craniofacial anomalies

Authors
Mattioli, F., Friðriksdóttir, R., Hebert, A., Bassani, S., Ibrahim, N., Naz, S., Chrast, J., Pailler-Pradeau, C., Oddsson, Á., Sulem, P., Halldorsson, G.H., Melsted, P., Guðbjartsson, D.F., Palombo, F., Pippucci, T., Nouri, N., Seri, M., Farrow, E.G., Saunders, C.J., Guex, N., Ansar, M., Stefansson, K., Reymond, A.
Source
Full text @ Genome Med.

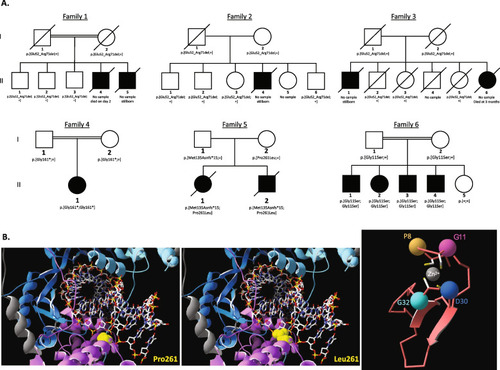
Identified biallelic variants in BRF2. A Pedigrees and the genotypes of the reported families. The offsprings of Icelandic families 1–3 were born in the 1970s, the 1950s, and 1920s, respectively. B 3D protein modelling of the identified missense variants. Pro261 highlighted in yellow is in close vicinity with the DNA backbone between two phosphate groups (left panel); the Pro261 is replaced by a Leucine highlighted in yellow in the middle panel. The bulkier sidechain of Leu261 will likely collide with the DNA. The right panel presents a schematic representation of the zinc-finger highlighting the conserved residues Gly11 (purple), Asp30 (dark blue), Gly32 (light blue), and Pro8 (gold). Coordination of the zinc-atom (gray) by the four conserved Cysteine (shown in sidechains) will expose the sidechains of Pro8, Gly11, Asp30, and Gly32

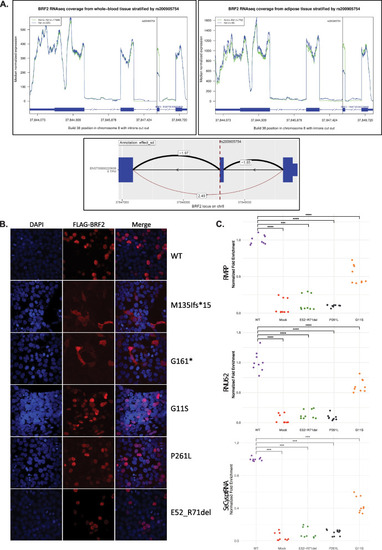
Variants assessments.
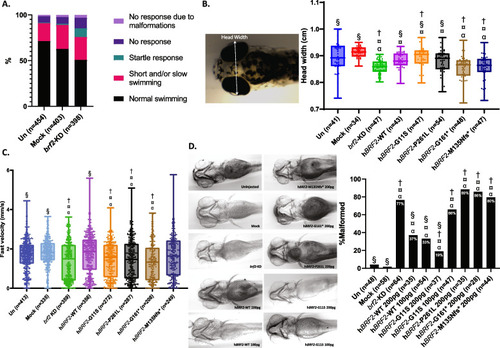
 A Effect on RNA expression of the splice donor variant BRF2(NM_018310.4):c.214 + 1G > A; p.(Glu52_Arg71del) (a.k.a. rs200905754). The median RNA-sequence coverage is reported for heterozygous (in blue) and noncarriers (in green) in blood (left top panel) and adipose tissue (right top panel). The splicing variant (dashed line in bottom panel) perturbs the correct splicing of exon 2 (black isoform, top cis-sQTL) and induces the skipping of that exon (red isoform: effect = 2.49 SD, P = 1.0 × 10−444). The splice junction usage quantification was calculated in terms of PSI (white labels). The dark blue squares represent exons of selected BRF2 transcripts which matched exon–intron boundary of the splice junctions. B Subcellular localization of FLAG-BRF2. Immunofluorescent staining with DAPI (blue) is shown on the left, FLAG-BRF2 (red) in the middle and the merged signals on the right. C ChIP-qPCR normalized fold enrichment analysis of RMRP, RNU6-2, and SeCys ptRNA loci occupancy by N-terminal FLAG-tagged BRF2. Comparison of FLAG-tagged BRF2 wild-type (WT) and mutants (FLAG-BRF2E52−R71del, FLAG-BRF2G11S, and FLAG-BRF2.P261L) HEK293T transfected cells with mock-treated cells. The statistical significance of pairwise comparisons between conditions was determined using the Wilcoxon rank-sum test, and significant differences are indicated with p-value annotations. ****p ≤ 0.0001; ***p ≤ 0.001

brf2-knocked-down zebrafish. A Touch-response test showing the percentage of the classified swimming movements upon a tactile stimulus on the tail for uninjected (Un), mock-injected (Mock), brf2-knocked down (brf2-KD) zebrafish larvae at 3 dpf. The number of tested larvae is indicated in parenthesis. B Head width (indicated by white arrows in the left panel) measurements Un-, Mock, brf2brf2-KD, and brf2-KD co-injected with human mRNA BRF2 wild-type (hBRF2-WT), Gly11Ser (hBRF2-G11S), Pro261Leu (hBRF2-P261L), Gly161* (hBRF2-G161*), Met135Asnfs*15 (hBRF2-M135Nfs*). The number of tested larvae is indicated in parenthesis. C Swimming fast velocity in the dark of Un, Mock, brf2-KD, and brf2-KD co-injected with human mRNA BRF2 wild-type (hBRF2-WT), Gly11Ser (hBRF2-G11S), Pro261Leu (hBRF2-P261L), Gly161* (hBRF2-G161*), Met135Asnfs*15 (hBRF2-M135Nfs*). D Alcian blue staining in zebrafish larvae at 5 dpf. On the left, representative ventral pictures of the Alcian blue staining showing jaw malformations of brf2-KD co-injected with human RNA BRF2 Pro261Leu (hBRF2-P261L 200 pg), Gly161* (hBRF2-G161* 200 pg), Met135Asnfs*15 (hBRF2-M135Nfs* 200 pg), and half dose of BRF2 Gly11Ser RNA (hBRF2-G11S 100 pg) compared with illustrative pictures of the normal jaw structure observed in Un, Mock, and brf2-KD co-injected with human BRF2 wildtype at normal (hBRF2-WT 200 pg) and half dosage (hBRF2-WT 100 pg) and Gly11Ser (hBRF2-G11S 200 pg). The fraction of the observed deformed jaw structure is presented in the right panel as a percentage. *** P < 0.001; ** P < 0.005; ns = not significant; § significant vs brf2- KD (P < 0.05); ¤ significant vs Mock (P < 0.05); † significant vs h BRF2 -WT (P < 0.05); α significant vs Un (P < 0.05)

Acknowledgments
This image is the copyrighted work of the attributed author or publisher, and ZFIN has permission only to display this image to its users. Additional permissions should be obtained from the applicable author or publisher of the image. Full text @ Genome Med.