
Fig. 7
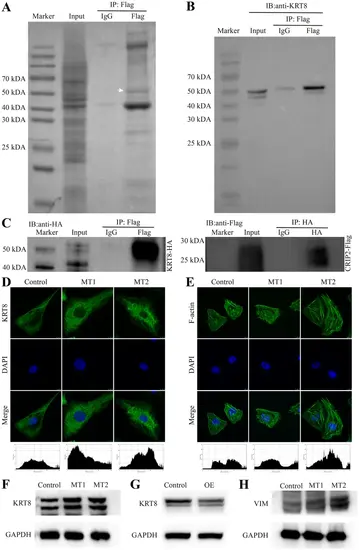
KRT8 interacts with CRIP2 and is negatively regulated by CRIP2. (A) Identification of potential CRIP2-interacting proteins by immunoprecipitation using a Flag antibody in CRIP2-Flag-overexpressing cell lines. The white arrow indicates the bands for mass spectrometry sequencing. (B) Validation of the interaction between KRT8 and CRIP2 via KRT8 antibody immunoblotting. (C) CRIP2 coimmunoprecipitates with KRT8. (D, E) The expression of KRT8 and F-actin in the absence of CRIP2. DAPI was used to stain the nucleus. Below the images are the fluorescence intensity analysis data. The x-axis represents the horizontal distance across the image from left to right, whereas the y-axis represents the gray value corresponding to the fluorescence intensity. (F) KRT8 expression in the absence of CRIP2, as determined by Western blotting. (G) KRT8 expression following CRIP2 overexpression, as determined by Western blotting. (H) Western blot analysis of Vimentin expression in the absence of CRIP2 |