|
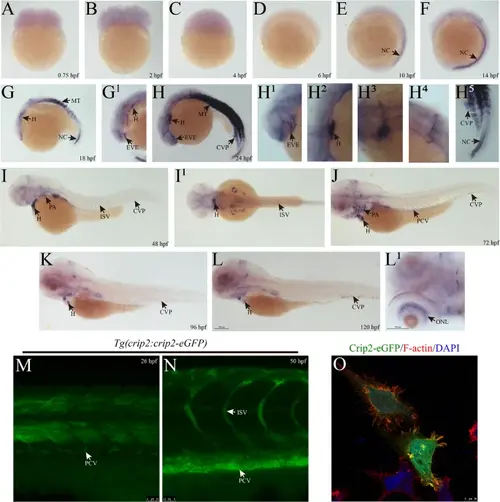
The expression profiles of zebrafish Crip2 during early vascular development. (A–L) Expression of crip2 determined via WISH in zebrafish early embryos. The figure marked with numbers in the upper right corner is a partial enlargement of the corresponding region. (M–N) Expression of Crip2 in early embryonic blood vessels of Tg(crip2:crip2-eGFP) zebrafish. The zebrafish transgenic line was constructed by expressing the Crip2-eGFP fusion under the control of the promoter region of crip2. Z-axis photography was performed, and the target areas were superimposed. (O) Subcellular localization of Crip2 in zebrafish via the transfection of pcDNA3.1-crip2-eGFP in HUVECs. TRITC-phalloidin and DAPI were used to stain F-actin and the nucleus, respectively. NC: notochord; MT: myotome; H: heart; EVE: eye blood vessel endothelial cell; CVP: caudal vein plexus; ISV: intersegmental vein; PA: pharyngeal arch; PCV: posterior cardinal vein; ONL: outer nuclear layer. hpf: hours post fertilization
|