
Fig. 2
- ID
- ZDB-FIG-250416-33
- Publication
- Le et al., 2025 - Midkine-a interacts with Ptprz1b to regulate neural plate convergence and midline formation in the developing zebrafish hindbrain
- Other Figures
- All Figure Page
- Back to All Figure Page
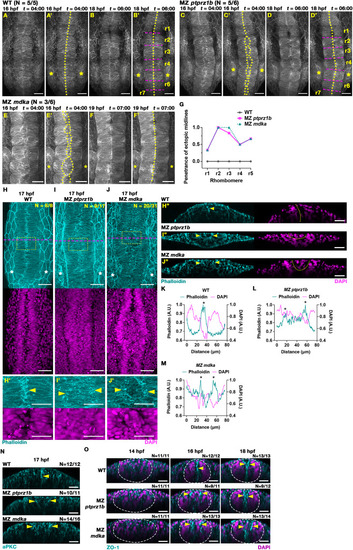
MZ ptprz1b, MZ mdka and MZ ptn mutants exhibit transient ectopic midline formation in rhombomeres. (A-B) Representative MIP still images in dorsal views taken from confocal time-lapse analysis at 4 and 6 h of time-lapse showing normal midline formation in rhombomeres of WT embryos. Imaging was done from approx. 12 hpf with 4 min intervals. PMT-mEGFP was injected to mark cell membranes. Elapsed time (t) is displayed as hours:minutes (hh:mm). Midline structures are delineated by yellow dotted lines. Magenta dashed lines delineate rhombomere boundaries. Asterisks label position of otic vesicles at r5. Scale bar = 50 μm. (C-D) Transient ectopic midline in MZ ptprz1b mutant labelled by PMT-mEGFP. Scale bar = 50 μm. (E-F) Transient ectopic midline in MZ mdka mutant labelled by PMT-mApple. Still images taken from confocal time-lapse analysis at 4 and 7 h. Scale bar = 50 μm. (G) Quantification of penetrance of ectopic midline phenotype in each rhombomere in WT (N = 5), MZ ptprz1b (N = 6) and MZ mdka (N = 6). Data were acquired from three independent experiments. The penetrance of ectopic midlines is calculated by dividing the number of embryos with ectopic midlines in each rhombomere by the total number of embryos. (H-J) Representative MIP images of Phalloidin stained F-actin (cyan) and DAPI stained nuclei (magenta) in rhombomere region of WT, MZ ptprz1b and MZ mdka mutant embryos at 17 hpf. Yellow dashed boxes indicate region shown in (H′-J′), and magenta dashed lines indicate the position of reconstructed orthogonal views shown in (H″-J″). Scale bar = 50 μm (H-J) and 30 μm (H′-J′, H″-J″). Arrowheads indicate F-actin accumulation. (K-M) Respective mean fluorescent intensity histograms of Phalloidin (cyan) and DAPI (magenta) along left-right axis of (H′-J′). Asterisks highlight aggregation of Phalloidin-stained F-actin. (N) Representative reconstructed orthogonal views of aPKCζ (cyan) immunostaining in WT, MZ ptprz1b and MZ mdka mutant at 17 hpf. Views are taken from r2 at comparable positions. Yellow arrowheads indicate aggregation of aPKCζ, respectively. Scale bar = 30 μm (O) Representative reconstructed orthogonal views after ZO-1 (cyan) and DAPI (magenta) staining in WT, MZ ptprz1b and MZ mdka mutant at 14, 16 and 18 hpf. Images are taken from r2 at comparable positions. Accumulation of ZO-1 is indicated by yellow arrowheads, and neural keel/rod is demarcated by white dashed lines. Scale bar = 30 μm. (For interpretation of the references to colour in this figure legend, the reader is referred to the Web version of this article.) |
Reprinted from Developmental Biology, 521, Le, Y., Rajasekhar, K., Loo, T.Y.J., Saunders, T.E., Wohland, T., Winkler, C., Midkine-a interacts with Ptprz1b to regulate neural plate convergence and midline formation in the developing zebrafish hindbrain, 52-74, Copyright (2025) with permission from Elsevier. Full text @ Dev. Biol.