|
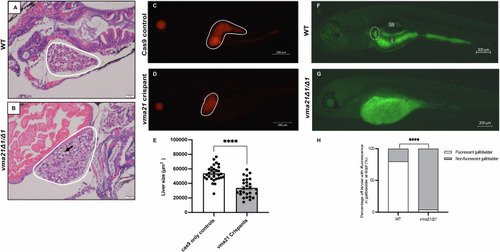
vma21 mutants have hepatic lipid accumulation, smaller liver size, and disrupted bile flux. Representative H&E staining of (A) WT and (B) ma21Δ1/Δ1 mutants at 6 dpf. The liver is outlined in white and the black arrow highlights a lipid droplet. n = 6 per group. Representative fluorescent images of the liver of (C) Cas9-only and (D) vma21 crispants injected into the Tg(Fabp:mCherry) transgenic line at 5 dpf. The fluorescent red liver is outlined in white. (E) Quantification of liver size at 6 dpf. n = 27–30/group. Data represented as mean ± SEM. Significance at ****P < 0.0001 (unpaired two-tailed t test). Representative fluorescent images of (F) wild-type (WT) and (G) vma21Δ1/Δ1 mutants (homozygous for a 1 base pair (bp) deletion in vma21) at 6 days post fertilization (dpf) fed a BODIPY diet. The gallbladder is outline by the white dotted line. ×32 Magnification, scale bar: 200 mm. SB swim bladder, i intestine. (H) Quantification of the percentage of larvae with fluorescence in the gallbladder at 6 dpf. n = 26-29/group. Data represented as mean ± SEM. Significance at ****P < 0.0001 (Fisher’s exact test). Source data are available online for this figure.
|