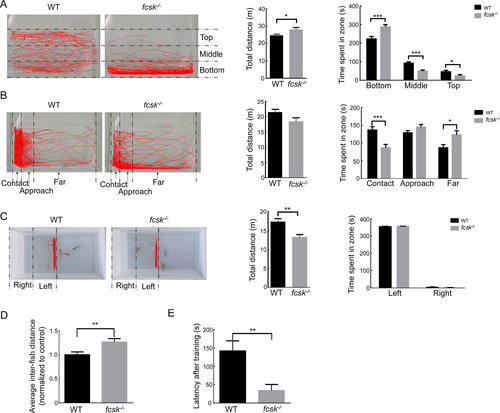
Behavioral assessments of adult zebrafish A: Novel tank test. Representative trajectory plots (left) and quantitative analysis (right) showing total movement distance and time spent in bottom, middle, and top regions in WT and fcsk−/− zebrafish (3 mpf, n=31 per group). B: Mirror biting test. Representative trajectory plots (left) and quantitative analysis (right) of total movement distance and time spent in contact, approach, and far zones in WT (n=23) and fcsk−/− (n=21) zebrafish (3 mpf). C: Social preference test. Representative trajectory plots (left) and quantitative analysis (right) showing a significant reduction in total movement distance in fcsk−/− zebrafish (3 mpf, n=20 per group), with no significant difference observed in time spent in left and right regions. D: Shoaling test. Average inter-fish distance was significantly increased in fcsk−/− zebrafish (3 mpf, n=24 per group), indicating reduced social cohesion. E: Modified T-maze test. fcsk−/− zebrafish (3 mpf) exhibited a significantly shorter latency to enter the punishment arm, suggesting impaired learning and memory function (n=24 per group).
|
