
Fig. 6
- ID
- ZDB-FIG-250410-12
- Publication
- Ramkumar et al., 2025 - Phased ERK responsiveness and developmental robustness regulate teleost skin morphogenesis
- Other Figures
- All Figure Page
- Back to All Figure Page
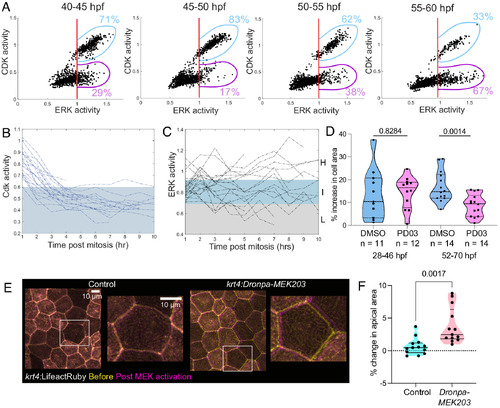
Cells switch from proliferative to nonproliferative responses to ERK signaling as periderm expansion slows. (A) Scatter plot of ERK and Cdk activities in periderm cells at respective time windows. The percentage of cells with high ERK activity and high Cdk activity (blue) decreases over time, while that of high ERK activity and low Cdk activity (pink) increases over time. There is a significant increase in the probability of being in the high ERK low Cdk group at later time points, computed using binomial distribution. P = 1.2817e-53. High ERK is denoted by cells with ERK activity >=1. n = 3 embryos, 210 cells. (B) Quantification of Cdk activity shows cells entering G1 following mitosis as seen by the drop in Cdk activity. Gray represents regime of Cdk activity where cells are in G1. T = 0 h is nuclear division; data are plotted from 1 h postmitosis. n = 4 embryos. (C) Quantification of ERK activity shows that following mitosis, cells sporadically inactivate ERK signaling as seen by the spread of ERK activity from 1 to 10 h, leading to a more heterogenous population. Gray, blue, and white shaded regions represent regime of L-inactive/low (L), I-intermediate, and H-high ERK signaling based on PD0325901 treatment. n = 4 embryos. (D) Quantification of increase in average apical cell area upon DMSO or 2 µM PD0325901 treatment for 18 h with treatment beginning at 28 hpf or 52 hpf. While there is no significant change in the increase in the apical area between control DMSO and PD03-treated embryos at 28 hpf, there is a significantly lower increase in area upon PD03 treatment at 52 hpf. Percentage increase in cell area at 28 hpf - DMSO = 13.56%, n =11 embryos and PD03 = 14.41%, n = 12 embryos, P = 0.8284 Welch’s t test. Percentage increase in cell area at 52 hpf - DMSO = 16.86%, n = 14 embryos and PD03 = 8.823%, n = 14 embryos, P = 0.0014 Welch’s t test. (E) Maximum projection views of periderm cells expressing lifeact-Ruby before and 1 h post photoconversion at 54 to 56 hpf. The lower panel shows higher magnification view of corresponding boxed cells. (Scale bar, 10 µm.) (F) Quantification of change in the apical area upon MEK activation. The apical area of periderm cells increases by 3.8% in Dronpa-MEK203-expressing larvae 1 h post MEK activation, while it only increases by 0.6% in stage-matched control larvae imaged at a similar body region encompassing around ~60 cells per larvae. Welch’s t test, P = 0.0017, n = 13 larvae in both conditions. |