
FIGURE
Fig. 11
- ID
- ZDB-FIG-250327-109
- Publication
- Perone et al., 2025 - Zebrafish Cyp1b1 knockout alters eye and brain metabolomic profiles, affecting ocular and neurobehavioral function
- Other Figures
- All Figure Page
- Back to All Figure Page
Fig. 11
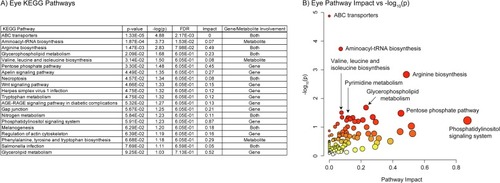
A) Table of KEGG pathways in the eye with raw p-value < 0.1 (n=20, weighted z-test). B) Plot of KEGG pathway impact score vs pathway -log10(p). Pathway impact is represented by size (larger size = greater impact) while -log10(p) is represented by color (white = low and red = high). There were 11 perturbed pathways when considering raw p-value, however only two were significant when using an FDR method. |
Expression Data
Expression Detail
Antibody Labeling
Phenotype Data
Phenotype Detail
Acknowledgments
This image is the copyrighted work of the attributed author or publisher, and
ZFIN has permission only to display this image to its users.
Additional permissions should be obtained from the applicable author or publisher of the image.
Full text @ Tox. App. Pharmacol.