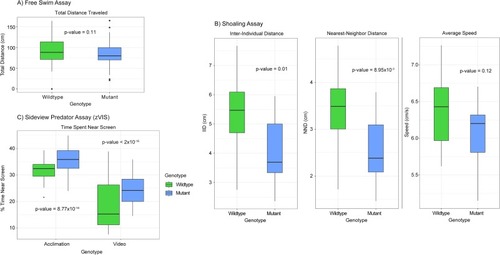
A) Box plot of the free swim assay. A single fish is placed in the tank and allowed to swim without interruption while its movement is tracked. The total distance swam is displayed on the y-axis and measured in cm. There was no significant difference between the genotypes when measuring total distance traveled. P-value = 0.11, n = 62 WT and 56 mutant, one-way ANOVA. For all the following box plots the data within the interquartile range (IQR) was represented by the box, the whiskers represented data 1.5 times the IQR, and any data point beyond that appears as a dot. B) Box plots of the shoaling assay. Four fish (two male and two female) are placed in the tank and allowed to swim without interruption while movement is tracked. Three metrics of behavior are tracked: inter-individual distance (IID-the average distance between all fish in cm), nearest-neighbor distance (NND-the average distance between the two nearest fish in cm), and average speed measured in cm/s. A significant difference in both IID and NND was observed between genotypes. No significant difference was observed when measuring average speed. P-value = 0.01, 8.95x10⁻³, and 0.12, n = 16 WT and 12 mutant, one-way ANOVA. C) Box plot of the sideview predator assay (zVIS). A single fish is placed in a tank near a computer screen. During the acclimation period no image is displayed on the screen, but during the video period a natural predator of the zebrafish is shown. The movement of the fish is tracked during both periods and percent time spent in the 1/3 of the tank nearest the screen is calculated as % time near screen. Mutant zebrafish performed differently during both the acclimation and the video portion of the assay spending more time closer to the screen when compared to the wildtype. P-value = 8.77x10⁻¹⁴ and < 2x10-16, n = 61 WT and 57 mutant, three-way ANOVA.
|
