
FIGURE
Figure 12
- ID
- ZDB-FIG-250228-21
- Publication
- Didloff et al., 2025 - Exploring Antimycobacterial Potential: Safety Evaluation and Active Compound Isolation from Gymnopilus junonius
- Other Figures
- All Figure Page
- Back to All Figure Page
Figure 12
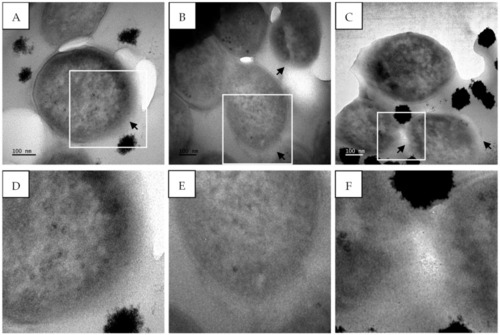
Transmission electron micrographs of |
Expression Data
Expression Detail
Antibody Labeling
Phenotype Data
Phenotype Detail
Acknowledgments
This image is the copyrighted work of the attributed author or publisher, and
ZFIN has permission only to display this image to its users.
Additional permissions should be obtained from the applicable author or publisher of the image.
Full text @ Antibiotics (Basel)