
Fig. 1
- ID
- ZDB-FIG-250228-111
- Publication
- Kalanithy et al., 2024 - TFAP2E is implicated in central nervous system, orofacial and maxillofacial anomalies
- Other Figures
- All Figure Page
- Back to All Figure Page
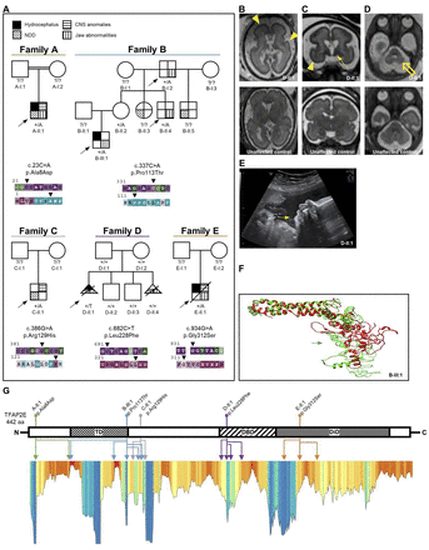
Clinical and molecular data of families with heterozygous transcription factor activator protein 2 (TFAP2E) missense variants. (A) Family pedigrees of individuals with heterozygous variants in TFAP2E and respective ConSurf conservation analysis for base pair (upper row) and amino acid (aa) conservation (lower row). Affected individuals are indicated with different shapes for each phenotype according to the legend. Arrowheads indicate the respective variant position. Purple/red colour indicates high conservation of the respective residue. Note the multiplex family B with overlapping orofacial and maxillofacial and neurodevelopmental phenotype (table 1, online supplemental data 1) and the de novo variant in the female individual D-II:1. The arrows indicate probands. Filled shapes reflect affected status. (B–D) Fetal brain MRI of D-II:1 (upper panel) compared with that of a healthy subject with similar gestational age as reference (lower panel). Besides the obvious microcephaly, note the reduced sulcation with smooth brain surface characteristic of lissencephaly (B, C, yellow arrowheads). Furthermore, an overall abnormal signal intensity of subcortical white matter as well as hypotrophy of basal ganglia is evident (C, yellow solid arrow). The suspected cerebellar hypoplasia was seen in the axial plane (D, yellow hollow arrow). (B) Axial T2 TSE (turbo spin echo), (C) coronal SSFP (steady-state free precession), (D) axial SSFP. (E) Ultrasound imaging of fetus D-II:1 at gestational week 30+4 shows severe retrognathia (white arrow). (F) Computational 3D protein modelling of TFAP2E showing the native prediction (green) and the variant prediction of B-III:1 (red). The variant site is marked by the respective (green/red) arrow. The missense variant changes the polarity of the aa residue, leading to conformation changes of the neighbouring aa. This completely changes the 3D structure of the affected transactivation domain. (G) Linearised visualisation of the TFAP2E protein and lollipop chart indicating the localisation of the individuals’ aa variants, which are colour-coded according to the family pedigrees in A. The identically colour-coded double-headed arrows below indicate the multiple positions of the variants’ structural effects predicted by our protein modelling data. Lower panel: Metadome Protein Tolerance Landscape indicating the residues with general intolerance to structural variations (orange–red colour indicates high intolerance). Note that for some variants a secondary effect to a neighbouring position and not the variant location itself are in a region of strong intolerance. That is true for p.Ala8Asp (A-II:1), p.Pro113Thr (B-III:1) and p.Leu228Phe (D-II:1) (online supplemental table 1). CNS, central nervous system; DBD, DNA-binding domain; DiD, dimerisation domain; NDD neurodevelopmental disorder; TD transactivation domain. |