
Fig. 3
- ID
- ZDB-FIG-250227-10
- Publication
- Deebani et al., 2025 - Knockdown of zebrafish tmem242 enhances the production of ROS that signals to increase f9a expression resulting in DIC-like condition
- Other Figures
- All Figure Page
- Back to All Figure Page
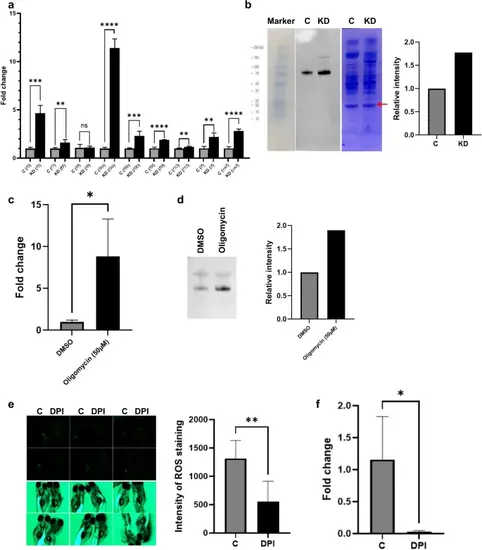
Expression of coagulation factors in tmem242 knockdown and the correlation of ROS and f9a. (a) mRNA expression of coagulation cascade factors in the control (C) and tmem242 knockdown (KD) zebrafish (n = 4). The graph shows the mRNA fold change after knocking-down tmem242 for nine different genes, f5, f7, f8, f9a, f9b, f9l, f10, tf, and vwf. f9a has a tremendous increase in mRNA expression after tmem242 is knocked down. (b) F9a protein expression in control and tmem242 knockdown zebrafish. Immunoblotting was performed on plasma (n = 4). The left image shows the protein marker, F9a bands for control and knockdown samples, and Coomassie brilliant blue staining. The graph on the right quantifies the relative intensity of F9a bands by measuring the ratio between the intensity of the F9a band and the intensity of a band from the Coomassie-stained bands (indicated by the red arrow) for both the control and the tmem242 knockdown samples. (c) The relative mRNA expression of f9a in the DMSO and oligomycin group (n = 4). (d) Immunoblotting was performed against zebrafish F9a protein using plasma from DMSO-treated zebrafish and oligomycin-treated zebrafish (n = 4); the bottom bands indicate F9a protein. The graph represents the relative intensity of the F9a bands in the control and oligomycin groups. (e) ROS production in the control and DPI-treated larvae using DCFH-DA staining. Images of zebrafish larvae in the fluorescence dark-field (top) and fluorescence bright-field (bottom) were taken for the control and DPI-treated 5-dpf zebrafish larvae (n = 6). The graph represents the signal intensity of DCFH-DA staining, which indicates ROS, for the control and DPI-treated larvae. (f) The relative mRNA expression of f9a in the control and DPI-treated zebrafish (n = 4); the graph shows the f9a mRNA expression decreased after the treatment with DPI. Error bars, mean ± s.d. P values were calculated by Student’s t-test. *P < 0.05, **P < 0.01, ***P < 0.001 and ****P < 0.0001; ns not significant. |