
- Title
-
Knockdown of zebrafish tmem242 enhances the production of ROS that signals to increase f9a expression resulting in DIC-like condition
- Authors
- Deebani, A., Mary, J., Dhinoja, S., Al Qaryoute, A., Fallatah, W., Jagadeeswaran, P.
- Source
- Full text @ Sci. Rep.
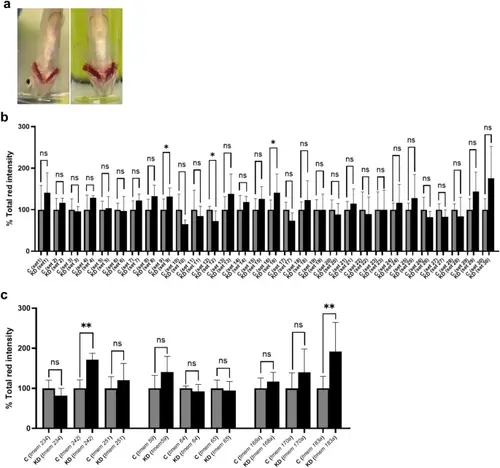
Screening of tmems found in zebrafish thrombocytes using gill bleeding assay. Both control (C) and tmems knockdown (KD) zebrafish were subjected to the gill bleeding assay (n = 6). (a) Images of gill bleeding in KD zebrafish on the right compared to the control zebrafish on the left. Note greater gill bleeding in KD zebrafish. (b) Bar graph showing knockdown of tmems within the 30 sets. The quantification of total red intensity emanating from red pixels observed in the control zebrafish is compared with KD zebrafish. Each gene set is evaluated within its respective control and KD groups. (c) Bar graph illustrating the individual gene knockdowns within sets 9, 12, and 16. Error bars, mean ± s.d. P values were calculated by Student’s t-test. *P < 0.05 and **P < 0.01; ns not significant. |
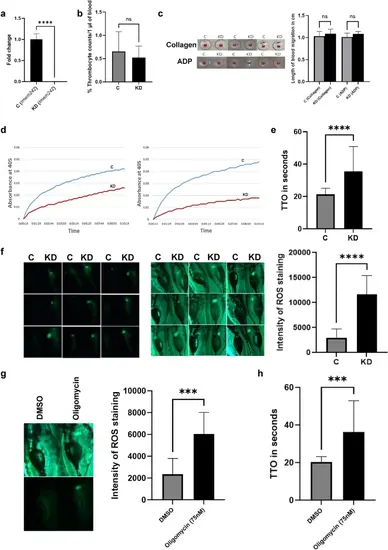
Functional evaluation of tmem242 knockdown. (a) The relative mRNA expression of tmem242 in the control (C) and tmem242 knockdown (KD) zebrafish (n = 4). (b) Comparison of the number of thrombocytes between control and tmem242 knockdown zebrafish (n = 7). (c) Whole blood aggregation assay results showing aggregation in whole blood in response to collagen and ADP agonists for both control and tmem242 knockdown zebrafish (n = 6) (only three replicates for each agonist are shown). Graphs depict the length of blood migration from the well origin down the wall. (d) Kinetic coagulation assays performed using the control and tmem242 knockdown zebrafish plasma (n = 5). Panels represent kinetic curves of fibrin formation in kPTT (left) and kPT (right). (e) Laser-induced venous thrombosis in control and tmem242 knockdown 5-dpf zebrafish larvae (n = 20). The TTO measured in seconds in control and tmem242 knockdown larvae. (f) ROS production in the control and tmem242 knockdown larvae. Images of ROS in zebrafish larvae in the fluorescence dark-field (left) and fluorescence bright-field (right) (n = 9). Each of the nine squares has C (control) and KD (tmem242 knockdown) larvae. The graph represents the fluorescence intensity of ROS signal for the control and the tmem242 knockdown larvae from the fluorescence dark-field. (g) ROS production in the control (DMSO) and oligomycin-treated larvae. Images of ROS in zebrafish larvae in the fluorescence bright-field (top) and fluorescence dark-field (bottom) (n = 9, only one is shown). The graph represents the fluorescence intensity of ROS signal for the control and oligomycin-treated larvae. (h) Laser-induced venous thrombosis in control and oligomycin-treated 5-dpf zebrafish larvae (n = 17). Error bars, mean ± s.d. P values were calculated by Student’s t-test. ***P < 0.001 and ****P < 0.0001; ns not significant. |
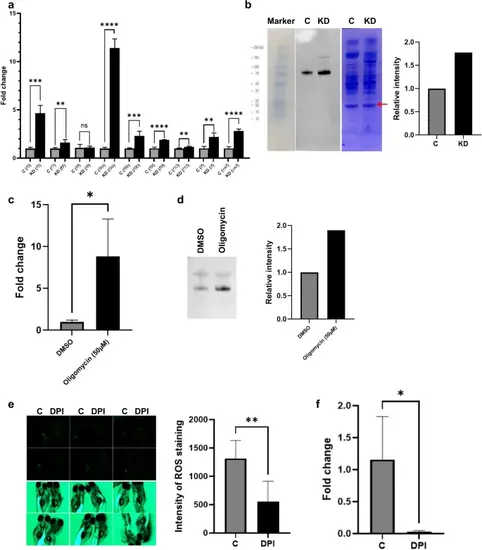
Expression of coagulation factors in tmem242 knockdown and the correlation of ROS and f9a. (a) mRNA expression of coagulation cascade factors in the control (C) and tmem242 knockdown (KD) zebrafish (n = 4). The graph shows the mRNA fold change after knocking-down tmem242 for nine different genes, f5, f7, f8, f9a, f9b, f9l, f10, tf, and vwf. f9a has a tremendous increase in mRNA expression after tmem242 is knocked down. (b) F9a protein expression in control and tmem242 knockdown zebrafish. Immunoblotting was performed on plasma (n = 4). The left image shows the protein marker, F9a bands for control and knockdown samples, and Coomassie brilliant blue staining. The graph on the right quantifies the relative intensity of F9a bands by measuring the ratio between the intensity of the F9a band and the intensity of a band from the Coomassie-stained bands (indicated by the red arrow) for both the control and the tmem242 knockdown samples. (c) The relative mRNA expression of f9a in the DMSO and oligomycin group (n = 4). (d) Immunoblotting was performed against zebrafish F9a protein using plasma from DMSO-treated zebrafish and oligomycin-treated zebrafish (n = 4); the bottom bands indicate F9a protein. The graph represents the relative intensity of the F9a bands in the control and oligomycin groups. (e) ROS production in the control and DPI-treated larvae using DCFH-DA staining. Images of zebrafish larvae in the fluorescence dark-field (top) and fluorescence bright-field (bottom) were taken for the control and DPI-treated 5-dpf zebrafish larvae (n = 6). The graph represents the signal intensity of DCFH-DA staining, which indicates ROS, for the control and DPI-treated larvae. (f) The relative mRNA expression of f9a in the control and DPI-treated zebrafish (n = 4); the graph shows the f9a mRNA expression decreased after the treatment with DPI. Error bars, mean ± s.d. P values were calculated by Student’s t-test. *P < 0.05, **P < 0.01, ***P < 0.001 and ****P < 0.0001; ns not significant. |
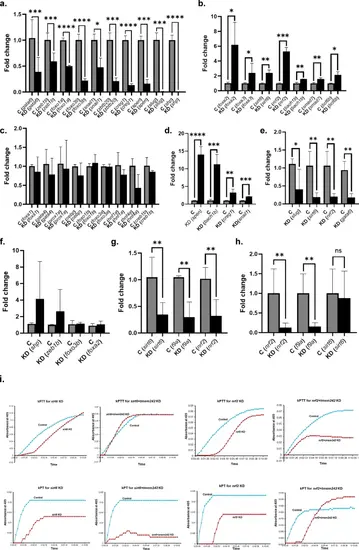
Expression of hepatocyte transcription factors in tmem242 knockdown and the effect of knockdown of hepatocyte transcription factors, modulated after tmem242 knockdown, on f9a mRNA levels. (a-c) Decreased, increased, and unaltered mRNA levels of hepatocyte transcription factors, respectively, in control [C] and tmem242 knockdown [KD] zebrafish (n = 4). (d-f) Increased, decreased, and unaltered f9a mRNA levels, respectively, in control [C] and hepatocyte transcription factor knockdown [KD] zebrafish (n = 4), each hepatocyte transcription factor represented by the parenthesis. (g) The effect of sirt6 knockdown on the mRNA expression of sirt6, f9a, and nrf2 (n = 4). (h) The effect of nrf2 knockdown on the mRNA expression of nrf2, f9a, and sirt6 (n = 7). Error bars, mean ± s.d. P values were calculated by Student’s t-test. *P < 0.05, **P < 0.01, ***P < 0.001 and ****P < 0.0001; ns not significant. (i) Kinetic coagulation assays performed using the sirt6 and nrf2 knockdown individually and in combination with tmem242 knockdown zebrafish plasma. Panels represent kinetic curves of fibrin formation in kPTT (top) and kPT (bottom). |
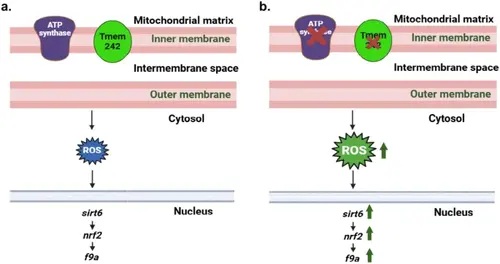
Tmem242 role in hemostasis. The model elucidates the regulatory mechanism by which Tmem242 modulates the expression of the coagulation factor gene, f9a. The schematic drawing portrays the physiological state in the presence of Tmem242 (a) compared with the consequences of tmem242 knockdown (b). Upon Tmem242 depletion, inhibition of ATP synthase activity occurs, culminating in increased ROS production. Subsequently, the heightened ROS levels induce upregulation of sirt6 expression, which in turn, promotes increased expression of nrf2, which in this study was found to be an activator for f9a transcription. Consequently, elevated levels of f9a mRNA results in increased F9a protein production, which along with the other coagulation factors contributes to the observation of abnormal hemostatic function resembling the characteristics of DIC pathology. |