FIGURE

Figure 9

ID
ZDB-FIG-250226-32
Publication
Zheng et al., 2025 - Exploring the Efficacy and Target Genes of Atractylodes Macrocephala Koidz Against Alzheimer's Disease Based on Multi-Omics, Computational Chemistry, and Experimental Verification
Other Figures
All Figure Page
Back to All Figure Page
Figure 9

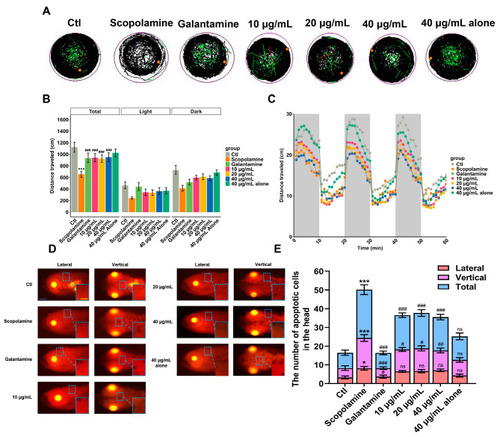
Locomotion analysis and apoptosis assessment. (A) Representative images of digital tracks. The black lines indicate slow-speed movement; green lines are linked to medium-speed movement; red lines are associated with high-speed movement; orange dots represented the initial position. (B) The total distance traveled by zebrafish exposed to different concentrations of AMK at 6 dpf. (C) Velocity in light–dark challenge, which contained three cycles of light–dark phases, lasting 10 min for each phase. (D,E) Representative dorsal and lateral views of the zebrafish brain showing apoptotic cells within the brain; scale bar: 200 μm. Quantification of apoptotic cells in the zebrafish brain; each group (n = 6). * p < 0.05; ** p < 0.01 *** p < 0.001; ns—not significant; vs. Ctl. # p < 0.05; ## p < 0.01; ### p < 0.001 vs. AD. AD—Alzheimer’s Disease Group, Ctl—Control Group.

Expression Data

Expression Detail
Antibody Labeling
Phenotype Data

Phenotype Detail
Acknowledgments
This image is the copyrighted work of the attributed author or publisher, and ZFIN has permission only to display this image to its users. Additional permissions should be obtained from the applicable author or publisher of the image. Full text @ Curr. Iss. Mol. Biol.