
Fig. 5
- ID
- ZDB-FIG-250217-32
- Publication
- Mazzaferro et al., 2025 - Functionally characterizing obesity-susceptibility genes using CRISPR/Cas9, in vivo imaging and deep learning
- Other Figures
- All Figure Page
- Back to All Figure Page
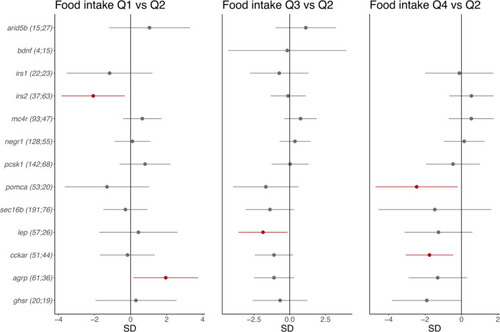
The effect of CRISPR/Cas9-induced mutations in 13 obesity genes on food intake in 8-day-old CRISPR/Cas9 founders. Dots and error bars show effect sizes and 95% confidence intervals for affected larvae (number on the left) vs. controls (number on the right). The effect of being in the first quartile of food intake [Q1]; left); the effect of being in the third quartile (Q3; middle); the effect of being in the top quartile (Q4; right). All are compared with the second quartile (Q2) as a reference. The results for |