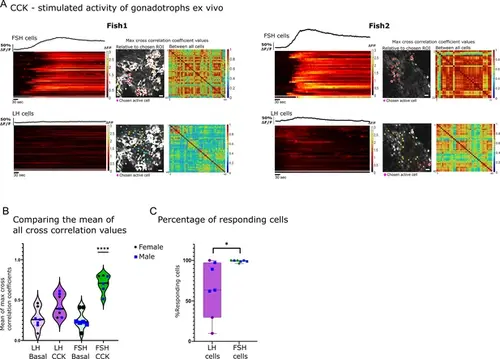
Follicle-stimulating hormone (FSH) cells are directly stimulated by cholecystokinin (CCK). (A) Example of calcium analysis of FSH and luteinizing hormone (LH) cells during CCK stimulation: fish1 with only FSH cells responding, and fish2 with FSH and LH cells responding. For each fish, the left panels are a heatmaps of calcium traces (ΔF/F), where each line represents a cell. On top of each heatmap is a graph showing the mean calcium trace, the separated line at the bottom of the heat map is the calcium trace of the chosen region of interest (ROI). On the right are color-coded data points that are superimposed on the imaged cells, showing the maximum cross-correlation coefficient between a calcium trace of a chosen active ROI and those of the rest of the cells in the same population, next to it is a matrix of max cross-correlation coefficients between all the cells. (scale bar = 20 µm) (B) The mean of max cross-correlation coefficient values in each cell type (n=7, 4 males, 3 females, one-way ANOVA, ****p<0.0001, see Figure 4—figure supplement 1B for detailed coefficient values distribution in each fish). (C) The percentage of active cells (i.e. a coefficient value higher than the 80 percentiles of basal levels) during CCK stimulation. Each dot represents one fish (n=7, 4 males, 3 females, unpaired t-test, *p<0.05).
|
