
Fig. 4
- ID
- ZDB-FIG-250124-52
- Publication
- Wu et al., 2024 - A miR-219-5p-bmal1b negative feedback loop contributes to circadian regulation in zebrafish
- Other Figures
- All Figure Page
- Back to All Figure Page
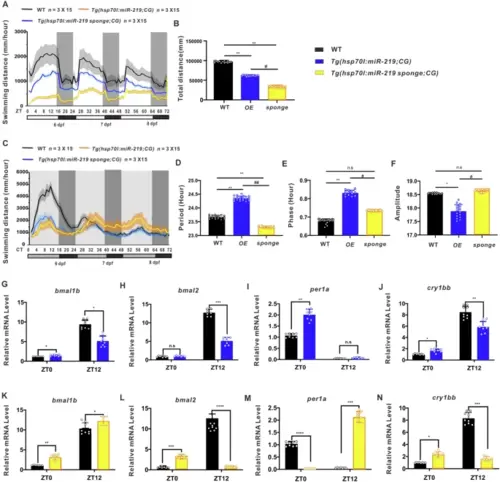
Disrupted rhythmicity of locomotor activities and expression of circadian clock genes in heat shock-inducible miR-219-5p overexpression or knockdown zebrafish larvae.Locomotor activities (A) and total swimming distance (B) of Tg(hsp70l:miR-219-5p;CG2) (OE) (blue), Tg(hsp70l:miR-219-5p sponge;CG2) (sponge) (yellow), and WT control (black) larvae under LD conditions. Data are mean ± SD. n = 3 × 15. Unpaired two-tailed Student’s t-test was performed, *P < 0.05, **P < 0.01, ***P < 0.001 vs. WT; #P < 0.05, ##P < 0.01 vs. Tg(hsp70l:miR-219-5p;CG2). Locomotor activities (C), period (D), phase (E), and amplitude (F) of Tg(hsp70l:miR-219-5p;CG2) (OE) (blue),Tg(hsp70l:miR-219 sponge;CG2) (sponge) (yellow), and WT control (black) larvae under DD conditions. Data are mean ± SD. n = 3 × 15. Unpaired two-tailed Student’s t-test was performed, *P < 0.05, **P < 0.01, ***P < 0.001 vs. WT; #P < 0.05, ##P < 0.01 vs. Tg(hsp70l:miR-219-5p;CG2). Expression of circadian clock genes bmal1b (G, K), bmal2 (H, L), per1a (I, M), and cry1bb (J, N) in Tg(hsp70l:miR-219-5p;CG2) (blue), Tg(hsp70l:miR-219 sponge;CG2) (yellow), and WT (black) larvae at 120 hpf/ZT0 and 132 hpf/ ZT12, as shown by qRT-PCR. Data are mean ± SD. n = 3 × 3. Unpaired two-tailed Student’s t-test was performed, *P < 0.05, **P < 0.01, ***P < 0.001 vs. WT. See also Figs. S7, S8, and S9. |