
Fig. 1
- ID
- ZDB-FIG-250124-49
- Publication
- Wu et al., 2024 - A miR-219-5p-bmal1b negative feedback loop contributes to circadian regulation in zebrafish
- Other Figures
- All Figure Page
- Back to All Figure Page
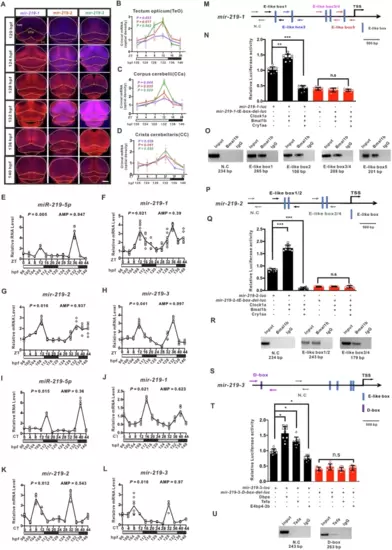
Rhythmically expressed miR-219-5p is regulated by the circadian clock.A Representative in situ hybridization staining images of pre-mir-219-1 (purple), pre-mir-219-2 (red), and pre-mir-219-3 (green) in zebrafish larvae from 120 to 140 hpf (hours postfertilization) under light-dark (LD), which are expressed primarily in Tectum opticum (TeO) (white), Corpus cerebelli (CCe) (yellow), and Crista cerellaris (CC) (orange). The scale bar is 50 μm. B–D Quantification and statistical analysis of in situ hybridization staining images of mir-219-1 (purple), mir-219-2 (red) (C), and mir-219-3 (green) (D) in (A) with ImageJ. Data are mean ± SD. n = 3 × 6. Staining intensities of mir-219-1 (purple), mir-219-2 (red), and mir-219-3 (green) in TeO (B), CCe (C), and CC (D) were analyzed with JTK_CYCLE, P < 0.05 indicates rhythmic expression. Rhythmic expression of mature miR-219-5p (E–I), mir-219-1 (F, J), mir-219-2 (G, K), and mir-219-3 (H, L) in zebrafish larvae from 120 to 140 hpf under light-dark (LD) (E–H) and constant dark (DD) (I–L) conditions, respectively, as shown by qRT-PCR. Data are mean ± SD. n = 6 × 3. JTK_CYCLE was performed, P < 0.05 indicates rhythmic expression. M Diagram of the mir-219-1 promoter containing E-like boxes. The scale bar is 500 bp. N Luciferase reporter assays of E-like boxes in the mir-219-1 promoter. Data are mean ± SD. One-way ANOVA (F = 1.051, P = 0.388) and unpaired two-tailed Student’s t-test and were performed, **P < 0.01, ***P < 0.001 vs. control. O ChIP assays of E-like boxes in the mir-219-1 promoter. P Diagram of the mir-219-2 promoter containing E-like Boxes. The scale bar is 500 bp. Q Luciferase reporter assays of E-like boxes in the mir-219-2 promoter. Data are mean ± SD. One-way ANOVA (F = 9.83, P = 0.197) and unpaired two-tailed Student’s t-test were conducted, *P < 0.05 vs. control. R ChIP assays of E-like Boxes in the mir-219-2 promoter. S Diagram of the mir-219-3 promoter containing D-boxes. The scale bar is 500 bp. T Luciferase reporter assays of D-boxes in the mir-219-3 promoter. Data are mean ± SD. One-way ANOVA (F = 3.68, P = 0.137) and Student’s t-test were performed, *P < 0.05 vs. control. U ChIP assays of D-Boxes in the mir-219-3 promoter. See also Figs. S1 and S2. |