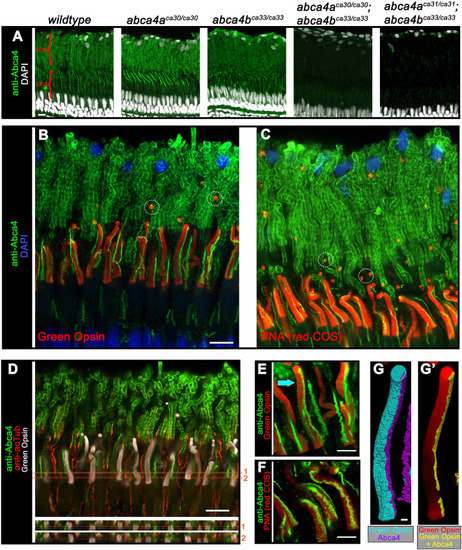
Abca4 protein location. (A) Confocal z-projections (z=2.5 µm) of the photoreceptor layer stained for Abca4 (green) in retinas obtained from 2-month-old wild-type, or abca4aca30/ca30, abca4bca33/ca33, abca4aca30/ca30;abca4bca33/ca33 and abca4aca31/ca31;abca4bca33/ca33 mutant zebrafish. Nuclei (white) were labeled with DAPI. Regions of rod outer segments (ROS) and cone outer segment (COS) are indicated by red brackets. (B,C) Confocal z-projections (z=5.4 µm) of photoreceptor layers from 4-month-old wild-type zebrafish co-stained for Abca4 (green) and either Green Opsin (red) or PNA (red) (B or C, respectively). Nuclei (blue) were labeled with DAPI. Encircled areas show examples of COS phagosomes stained for Abca4. (D) Confocal xy-slice view of the photoreceptor layer obtained from a 2-month-old wild-type fish, co-stained for Abca4 (green), acetylated tubulin (red) and Green Opsin (white). Numbers in red (on right) indicate the two xz-slice views (z=5.3 µm) that are shown below. (E,F) 3D-volume projections of COS obtained from 4-month-old wild-type zebrafish co-stained for Abca4 (green) and either green opsin (red; E) or PNA (red; F). Arrow in E indicates the COS that is volume-filled rendered in G and G′. (G,G′) To reveal protein colocalization, the single green COS, indicated by the arrow in E, is shown as a volume-filled rendering of Abca4 and Green Opsin antibody staining. Staining for Green Opsin (cyan) and Abca4 (purple) is shown in G; G′ shows staining for Green Opsin (red) as well as colocalized Green Opsin and Abca4 (yellow), with the latter largely being buried under area shown in purple in G. Scale bars: 10 µm (A,B,D), 5 µm (E,F), 1 µm (G).
|
