
Fig. 5
- ID
- ZDB-FIG-250103-16
- Publication
- Matheny-Rabun et al., 2024 - O-GlcNAcylation modulates expression and abundance of N-glycosylation machinery in an inherited glycosylation disorder
- Other Figures
- All Figure Page
- Back to All Figure Page
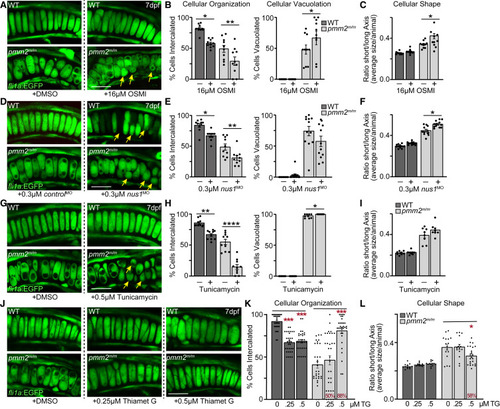
Reducing global O-GlcNAcylation, NgBR abundance, or Dpagt1 activity exacerbates cartilage phenotypes (A) Confocal images of fli1a:EGFP-labeled chondrocytes show OSMI-inhibition of O-GlcNAc exacerbates multiple phenotypes in pmm2m/m mutant chondrocytes. Yellow arrows highlight round unorganized cells. (B and C) (B) Graphs show OSMI treatment reduces the number of properly intercalated cells and increases the number of vacuolated cells, and (C) further impairs cell elongation, scored as the number of round cells. Graph represents average shape of cells per animal scored. See Figure S5 for measure of individual cells. N= 10 larvae per genotype per condition. (D) Confocal images of fli1a:EGFP-labeled chondrocytes show inhibiting nus1 expression also GlcNAc exacerbates multiple phenotypes in pmm2m/m mutant chondrocytes. Yellow arrows highlight round unorganized cells. (E) Graphs show inhibiting nus1 expression reduces the number of properly intercalated cells but does reduce cellular vacuolation (albeit not significantly). (F) Graph shows nus1 inhibition does impairs cell elongation, scored as the number of round cells. See Figure S5 for measure of individual cells. N= 10 larvae per genotype per condition. (G) Confocal images of fli1a:EGFP-labeled chondrocytes show tunicamycin-mediated inhibition of Dpagt1 also exacerbates phenotypes. Yellow arrows highlight round unorganized cells. (H) Graphs show inhibiting Dpagt1 reduces cellular intercalation but increases cellular vacuolation. (I) Graph of cell shape showing slight but insignificant increase in cellular roundness, with data represented as average shape of cells per animal scored. See Figure S5 for measure of individual cells, which also show increased roundness. N= 10 larvae per genotype per condition. For all experiments, error = SEM, Student’s t test, ∗p < 0.05, ∗∗p < 0.01, ∗∗∗∗p < 0.0001. Where a red line and red star are shown, the Welch’s test was used due to sample variance. ∗p < 0.05, ∗∗p < 0.01. (J) Confocal images of fli1a:EGFP-labeled chondrocytes show Thiamet G treatment, which enhances O-GlcNAc levels, improves phenotypes in a subset of animals. (K and L) (K) Graph shows treatment with 50 μM Thiamet G improves cellular intercalation in 88% of larvae assayed, with cell shape improved in 58% of larvae (L). For all experiments, error = SEM. The Dunnett’s statistical test was used to calculate significance. Red stars,∗p < 0.05, ∗∗∗p < 0.001. For all confocal images scale bars, 10 μm. See also Figure S5. |