
- Title
-
O-GlcNAcylation modulates expression and abundance of N-glycosylation machinery in an inherited glycosylation disorder
- Authors
- Matheny-Rabun, C., Mokashi, S.S., Radenkovic, S., Wiggins, K., Dukes-Rimsky, L., Angel, P., Ghesquiere, B., Kozicz, T., Steet, R., Morava, E., Flanagan-Steet, H.
- Source
- Full text @ Cell Rep.

UDP-HexNAc and protein O-GlcNAcylation are increased in pmm2 zebrafish mutants (A–C) (A) Schematic of sugar phosphate pathway. Arrows indicate whether metabolite abundance is increased or decreased in PMM2-CDG. Green, increased. Red, decreased. (B) Graph shows the level of glutamine trends higher in 6-dpf pmm2m/m larvae, while (C) UDP-HexNAc is significantly increased. n = 5 biological replicates per genotype consisting of 10 embryos each. (D) Western blot of protein O-GlcNAcylation comparing wild-type (pmm2+/+) and mutant (pmm2m/m) larvae 4–8 dpf shows increased O-GlcNAc modification present in mutants. n = 4 biological replicates of 10 embryos each per time point. (E) Graphs quantitating total O-GlcNAc levels across each lane show 2-fold higher levels present in mutants. Data are presented as fold change relative to wild-type samples and as values normalized only to total protein loaded, as indicated by Ponceau stains. (F) RNA-seq analysis of transcript abundances in WT and mutant larvae 5 and 8 dpf identify that several genes involved in the hexosamine biosynthetic and O-GlcNAc pathways are differentially expressed. Heatmaps show relative transcript abundances. n = 5 biological replicates of 10 embryos each per time point. p values are shown within the heatmap. (G) qRT-PCR analyses confirm gfpt abundance is nearly 9-fold higher in pmm2m/m mutants. n = 4 biological replicates of 10 embryos each per time point. (H) Western blot analyses comparing Gfpt, Ogt, and Oga protein abundances in 4- to 8-dpf WT and mutant larvae. (I–K) Graphs show quantitation of protein abundance values normalized only to total protein loaded, as indicated by Ponceau stains. (I) Gfpt, (J) Ogt, and (K) Oga. Error = SEM, Student’s t test, ∗p < 0.05, ∗∗p < 0.01. See also Figure S1. |

Multiple genes in the ER stress and N-linked glycosylation pathways are upregulated in pmm2m/m mutant larvae (A) Heatmaps of transcriptome data show multiple genes involved in the UPR and ER stress pathways are upregulated in pmm2m/m mutant larvae 5 and 8 dpf. n = 5 biological replicates per genotype with 10 embryos per sample. p values are shown within the heatmap. (B) qRT-PCR analyses performed 6 dpf confirm transcript abundance differences in several genes identified by RNA-seq. n = 3 biological replicates per genotype with 10 embryos per sample. (C) Graph of qRT-PCR analyses show both the unspliced and spliced forms of Xbp1 are increased in mutant larvae 6 dpf, with the ratio of the two similar between WT and mutant larvae. (D) Whole-mount in situ hybridization of hspa5 (BIP) show its abundance is particularly increased in cartilage, supporting a role for ER stress in skeletal pathogenesis. n = 35–40 embryos per genotype. Percentage values represent the number of embryos exhibiting the phenotype pictured. Scale bar, 20 μm. (E) Heatmaps of transcriptome data show multiple genes involved in N-linked protein glycosylation are upregulated in pmm2m/m mutant larvae 5 and 8 dpf. Also shown are a subset of genes (i.e., dpm1–3) involved in O-mannosylation. The OST and TRAP complexes are important for co-translation transfer of N-glycans. n = 5 biological replicates per genotype with 10 embryos per sample. p values are shown within the heatmap. (F) qRT-PCR analyses confirm increased abundance of several genes identified by RNA-seq. n = 4 biological replicates of 10 embryos each per genotype per time point. (G) Western blot analyses comparing protein abundances of the NgBR, Dpagt1, and Alg9 show increased abundance of NgBR and Dpagt1 in WT and mutant larvae with no change in Alg9. n = 3–5 biological replicates per genotype per time point, with each sample containing 10 embryos. Graphs show quantitation of the NgBR (H), Dpagt1 (I), and Alg9 (J) 4–8 dpf. (K) Immunohistochemical stains of the NgBR27 and Dpagt1 (red in fli1a:EGFP-positive cartilage show each protein is locally increased in mutant cartilages 7dpf. Scale bar, 10 μm. (L) Graphs showing pixel intensity of NgBR or Dpagt1 normalized to EGFP intensity. For all experiments, error = SEM, Student’s t test, ∗p < 0.05, ∗∗p < 0.01, ∗∗∗∗p < 0.0001. See also Figure S2. |

Epalrestat-mediated improvement of cartilage phenotypes is associated with a reduction in UDP-HexNAc and O-GlcNAcylation (A) Confocal images of WT and pmm2 mutant cartilages 7 dpf show treating with epalrestat 5 dpf significantly improves multiple phenotypes. Yellow arrows highlight vacuoles present in mutant cells. n = 20 embryos per genotype per condition. Scale bar, 10 μm. (B) Graphs show chondrocyte shape, the level of cellular intercalation (organization), and cellular vacuolation are all improved in pmm2 mutant cartilages following epalrestat treatment. Shape was assigned as the degree of “roundness” according to the ratio of the short and long axis, plotted here as average cell shape per animal. See Figure S5 for individual cellular measurements. n = 10 larvae scored across three independent experiments per genotype per condition. Error = SEM, Student’s t test, ∗p < 0.05, ∗∗∗∗p < 0.0001. (C) Graphs of UDP-HexNAc and glutamine abundance in DMSO and epalrestat-treated WT (pmm2+/+) and mutant (pmm2m/m) larvae 6 dpf. n = 12–20 biological replicates per genotype per condition, each containing 10 embryo per sample. Error = SD, two-way ANOVA multivariant analyses, p values shown in graphs. (D) Western blots show protein O-GlcNAcylation in WT and mutant larvae treated with either DMSO (−) or epalrestat (+) with reduced levels in treated mutants. ROI, region of interest used for quantitation. (E) Graphs show the level of protein O-GlcNAc in the three ROIs denoted on western blot. n = 3 biological replicates per genotype per condition with 10 larvae per sample. Error = SEM, Student’s t test, ∗∗p < 0.01. (F) Western blot show epalrestat treatment reduces Dpagt1 and NgBR abundance in mutant larvae, but has less effect on Gfpt and Alg9. This is quantitated in graphs of G) Dpagt1, H) NgBR, and I) Gfpt where data represent three biological replicates per genotype per condition of 10 embryo samples. Error = SEM, Student’s t test, ∗∗p < 0.01. (J–M) Immunohistochemical stains of 7dpf WT and mutant fli1a:EGFP positive cartilage sections show Dpagt1(J, red) and NgBR (K, red) abundances are locally reduced following epalrestat treatment. (L and M) Graphs show pixel intensity of Dpagt1 (L) and NgBR (M) relative to EGFP. Each data point represents a single cell. n = 10–20 cells in 6–10 embryos per genotype per condition. Error = SEM, Student’s t test, ∗p < 0.05 and ∗∗∗∗p < 0.0001. See also Figure S3. |

The abundances of Dpagt1 and the NgBR are influenced by O-GlcNAc (A) Western blot of O-GlcNAc modified proteins show treatment with 16 μM OSMI-1 reduces global O-GlcNAc levels in 6-dpf pmm2m/m mutant larvae. See Figure S4 for Ponceau gel. ROI1–3 represent three ROIs quantitated. (B) Graphs show quantitation of O-GlcNAc levels in three ROIs comparing DMSO or OSMI-treated mutant larvae. n = 5 biological replicates per genotype per condition with 10 embryos per sample. (C) Western blot comparing Dpagt1 and NgBR levels in WT and mutant larvae treated with OSMI-1 shows globally reducing protein O-GlcNAc levels corresponding to a reduction in their protein abundance. (D) Graphs comparing protein abundance of either Dpagt1 or the NgBR in OSMI-1-treated and untreated mutant larvae. See Figure S4 for graphs of WT quantitation and relative values normalized to Ponceau staining. n = 4–5 biological replicates per genotype per condition, each with 10 embryos per sample. (E) qRT-PCR analyses of transcript abundance of show no reduction after OSMI-1 treatment in any gene assayed 6 or 7 dpf. n = 3 biological replicates per genotype per condition with 10 embryos per sample. (F) Western blot of protein O-GlcNAc levels in Thiamet G-treated WT larvae. (G) Graph showing Thiamet G increases O-GlcNAc levels nearly 2-fold. n = 4 biological replicates per condition with 10 embryos per sample. (H) Western blot of DMSO or Thiamet G-treated WT shows increased O-GlcNAc levels correspond to an increase in the protein abundance of both Dpagt1 and the NgBR, with changes in Gfpt and Alg9 more variable. (I) Graphs show Dpagt1, NgBR, Gfpt, and Alg9 protein abundance in DMSO- or Thiamet G-treated animals. n = 3 biological replicates per condition. (J) PLAs performed on sections of WT and pmm2m/m mutant larvae 8 dpf show reactivity27 indicating both proteins may be O-GlcNAcylated. Reactivity is increased in mutants. Alg9 shows no reactivity. Scale bar, 10 μm. (K) Graph shows the number of cells per embryo per genotype that exhibit reactivity indicating O-GlcNAcylation of either Dpagt1 or the NgBR. n = 7 embryos per genotype. (L) Graph shows the signal intensity (normalized to EGFP) of individual cells that exhibits PLA positive reactivity. n = 6 embryos per genotype. (M and N) Western analyses of immunoprecipitated fractions using either anti-Dpagt1 (M) or anti-NgBR (N) antibodies. Blots were probed for Dpagt1, the NgBR, or for O-GlcNAc (as indicated on the figure). Arrows highlight expected protein forms (red and green arrows) and non-specific bands (blue). (O) Mechanistic model showing a mechanism whereby increased UDP-GlcNAc levels drive O-GlcNAcylation of Dpagt1 and the NgBR in mutant larvae. For all experiments, error = SEM, Student’s t test, ∗p < 0.05, ∗∗p < 0.01, ∗∗∗∗p < 0.0001. Where a red line and red star are shown, the Welch’s test was used due to sample variance. ∗p < 0.05. See also Figure S4. |
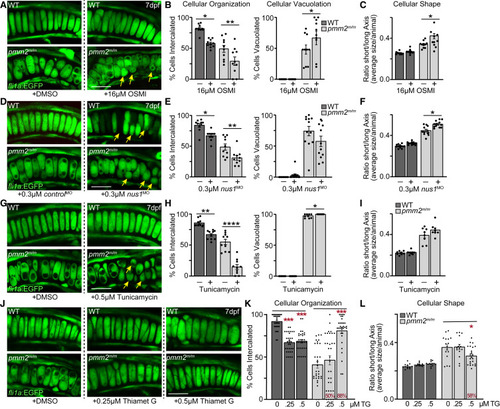
Reducing global O-GlcNAcylation, NgBR abundance, or Dpagt1 activity exacerbates cartilage phenotypes (A) Confocal images of fli1a:EGFP-labeled chondrocytes show OSMI-inhibition of O-GlcNAc exacerbates multiple phenotypes in pmm2m/m mutant chondrocytes. Yellow arrows highlight round unorganized cells. (B and C) (B) Graphs show OSMI treatment reduces the number of properly intercalated cells and increases the number of vacuolated cells, and (C) further impairs cell elongation, scored as the number of round cells. Graph represents average shape of cells per animal scored. See Figure S5 for measure of individual cells. N= 10 larvae per genotype per condition. (D) Confocal images of fli1a:EGFP-labeled chondrocytes show inhibiting nus1 expression also GlcNAc exacerbates multiple phenotypes in pmm2m/m mutant chondrocytes. Yellow arrows highlight round unorganized cells. (E) Graphs show inhibiting nus1 expression reduces the number of properly intercalated cells but does reduce cellular vacuolation (albeit not significantly). (F) Graph shows nus1 inhibition does impairs cell elongation, scored as the number of round cells. See Figure S5 for measure of individual cells. N= 10 larvae per genotype per condition. (G) Confocal images of fli1a:EGFP-labeled chondrocytes show tunicamycin-mediated inhibition of Dpagt1 also exacerbates phenotypes. Yellow arrows highlight round unorganized cells. (H) Graphs show inhibiting Dpagt1 reduces cellular intercalation but increases cellular vacuolation. (I) Graph of cell shape showing slight but insignificant increase in cellular roundness, with data represented as average shape of cells per animal scored. See Figure S5 for measure of individual cells, which also show increased roundness. N= 10 larvae per genotype per condition. For all experiments, error = SEM, Student’s t test, ∗p < 0.05, ∗∗p < 0.01, ∗∗∗∗p < 0.0001. Where a red line and red star are shown, the Welch’s test was used due to sample variance. ∗p < 0.05, ∗∗p < 0.01. (J) Confocal images of fli1a:EGFP-labeled chondrocytes show Thiamet G treatment, which enhances O-GlcNAc levels, improves phenotypes in a subset of animals. (K and L) (K) Graph shows treatment with 50 μM Thiamet G improves cellular intercalation in 88% of larvae assayed, with cell shape improved in 58% of larvae (L). For all experiments, error = SEM. The Dunnett’s statistical test was used to calculate significance. Red stars,∗p < 0.05, ∗∗∗p < 0.001. For all confocal images scale bars, 10 μm. See also Figure S5. |

NgBR abundance and O-GlcNAcylation are increased in the brains of pmm2m/m mutants (A) Western blot analyses of isolated brains show only abundance of the NgBR, but not Dpagt1 or Alg9, is increased in the mutant brain. (B) Graphs showing quantitation of protein abundances reveal 4- to 5-fold increases in the NgBR are matched in the mutant brain by variable Dpagt1 levels and a reduction in Alg9. n = 3 biological replicates per genotype per sample. (C) Western analyses of protein O-GlcNAcylation show no significant global changes in overall modification of brains proteins. (D) Graph quantitating O-GlcNAc shows little difference between WT and mutant brains. Abundance is normalized to Ponceau stains. n = 3 biological replicates per genotype per time point. (E and F) PLAs of NgBR and O-GlcNAc (E) or Dpagt1 and O-GlcNAc (F) interactions performed on sections of fli1a:EGFP-positive brains show O-GlcNAcylation of each protein is increased in the brains of pmm2m/m mutants. Boxed areas shown in lower panels highlight increased PLA reactivity.27 Blue, DAPI-stained nuclei. (G) Graphs show PLA signal intensity, scored as total pixel intensity across entire brain. n = 3–4 brains per genotype per condition. All scale bars, 20 μm. (H) Western blot of O-GlcNAc (relative to Ponceau stain) in brains of DMSO- or Thiamet G-treated larvae. (I) Graph of quantitation of total O-GlcNAc signal normalized to Ponceau. n = 3 biological replicates per condition. (J) Western blot of NgBR, Dpagt1, and Alg9 abundance in brains of Thiamet G-treated larvae. (K) Graph showing quantitation of total NgBR, Dpagt1, or Alg9 abundance (normalized to levels in untreated). n = 3 biological replicates per condition. For all experiments, error = SEM, Student’s t test,∗p < 0.05, ∗∗p < 0.01, ∗∗∗p < 0.001. See also Figure S6. |