
Fig. 3
- ID
- ZDB-FIG-241203-9
- Publication
- Chen et al., 2024 - Intestinal DHA-PA-PG axis promotes digestive organ expansion by mediating usage of maternally deposited yolk lipids
- Other Figures
- All Figure Page
- Back to All Figure Page
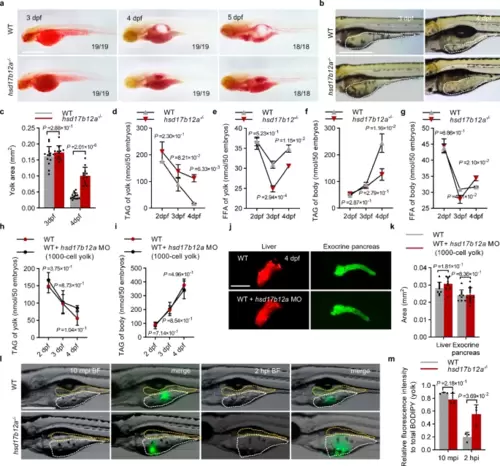
Malabsorption of yolk lipids results in expansion defectsa ORO (Oil Red O) staining was performed on embryos of WT and hsd17b12a−/− at 3 dpf, 4 dpf, and 5 dpf (n > 3). Scale bar, 0.5 mm. b Images of yolk in WT and hsd17b12a−/− at 3 dpf and 4 dpf. The white dotted line indicates the yolk region (n > 3). Scale bar, 1 mm. c Quantification of the area of the yolk in WT and hsd17b12a−/− at 3 dpf and 4 dpf. d–g The body and yolk of WT and hsd17b12a−/− were isolated at 2 dpf, 3 dpf, and 4 dpf, and the TAG (triglyceride) and FFA (free fatty acid) levels in the body and yolk were detected. h, i TAG content in the yolk and body of embryos with suppressed expression of YSL hsd17b12a was measured at 2 dpf, 3 dpf, and 4 dpf. j, k Fluorescence imaging of the liver and exocrine pancreas at 4 dpf in WT and WT with suppressed YSL hsd17b12a expression (n > 3), and quantification of the liver and exocrine pancreas. Scale bar, 500 μm. l Assessment of lipid transport by injection of BODIPY FL C12 (green) into the yolk in WT and hsd17b12a−/− at 4 dpf (n = 3). Images were captured at 10 mpi (10 min post-injection) and 2 hpi (2 h post-injection). The orange dotted line indicates intestinal lumen. The white dotted line indicates the region of yolk. Scale bar, 0.5 mm. m Relative analysis of the fluorescence intensity in the yolk compared to the total fluorescence (BODIPY) intensity (0 mpi) in the yolk at 10 mpi and 2 hpi. Data in d–i are presented as mean ± S.D., using a two-tailed Student’s t-test; n ≥ 3. Data in c, k, m are represented as mean ± S.D., using a two-tailed Student’s t test; each point represents an independent biological sample (n ≥ 3). Source data are provided as a Source Data file.. |