
Fig. 1
- ID
- ZDB-FIG-241203-7
- Publication
- Chen et al., 2024 - Intestinal DHA-PA-PG axis promotes digestive organ expansion by mediating usage of maternally deposited yolk lipids
- Other Figures
- All Figure Page
- Back to All Figure Page
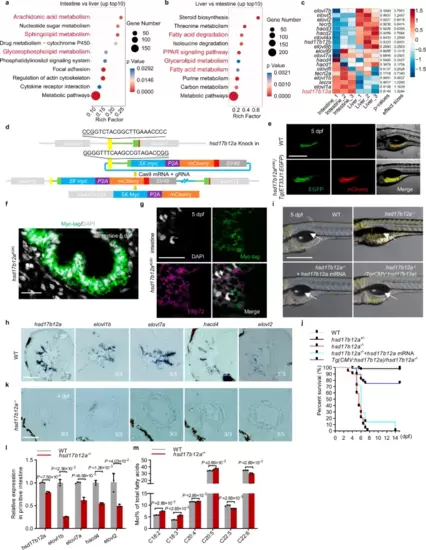
LC-PUFA synthesis facilitates the embryo-to-larval transition.a KEGG pathway analysis of genes highly expressed in intestine compared to liver at 5 dpf (p-value < 0.05). b KEGG pathway analysis of genes highly expressed in liver compared to intestine at 5 dpf (p-value < 0.05). c The heatmap illustrates enzyme expression related to long-chain polyunsaturated fatty acid (LC-PUFA) synthesis in the liver and intestine of WT at 5 dpf, showing p-values and effect sizes (n = 3) d Schematic of the knock-in strategy for inserting 5×Myc-P2A-mCherry into the hsd17b12a locus using CRISPR/Cas9. e The mCherry signal, confirmed not to be autofluorescence, co-localizes with the EGFP signal in the intestine-specific transgenic fish Tg(ET33J1:EGFP) at 5 dpf (n > 3). Scale bar, 200 μm. f Immunofluorescence staining of the intestine in hsd17b12aKI/KI using a Myc-tag antibody at 5 dpf (n = 3). Nuclei stained with DAPI. Scale bar, 200 μm. g Immunofluorescence staining of the intestine in hsd17b12aKI/KI using Myc-tag and ERp72 (ER) antibodies at 5 dpf (n = 3). Nuclei stained with DAPI. Scale bar, 200 μm. h Expression of genes related to LC-PUFA synthesis in WT at 4 dpf was detected using section in situ hybridization (n = 3). Scale bar, 50 μm. i Overexpression of hsd17b12a rescued the swim bladder inflation defect (n > 3). The arrows indicate the location of the swim bladder. Scale bar, 500 μm. j Survival curves were plotted for WT, hsd17b12a+/−, hsd17b12a−/−, hsd17b12a−/− with hsd17b12a mRNA, and Tg(CMV:hsd17b12a)/hsd17b12a−/−, respectively. k Expression of genes related to LC-PUFA synthesis in hsd17b12a−/− at 4 dpf was detected using section in situ hybridization (n = 3). Scale bar, 50 μm. l Expression of genes related to LC-PUFA synthesis in the primitive intestine was quantified by RT-PCR in WT and hsd17b12a−/− at 4 dpf. m Differential analysis of relative amounts of total FAs (fatty acids) in hsd17b12a−/− larvae compared to WT at 4 dpf. Data in l, m are represented as mean ± S.D., using a two-tailed Student’s t test; each point represents an independent biological sample (n = 3). Source data are provided as a Source Data file. |