
FIGURE
Figure 6
- ID
- ZDB-FIG-241115-87
- Publication
- Wu et al., 2024 - Study on the Function of Leptin Nutrient Acquisition and Energy Metabolism of Zebrafish (Danio rerio)
- Other Figures
- All Figure Page
- Back to All Figure Page
Figure 6
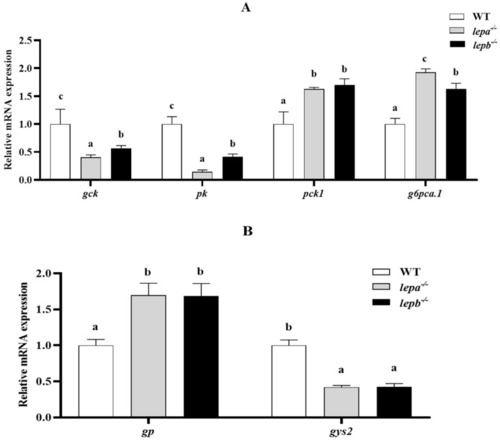
Expression levels of genes related to glucose metabolism in the liver. ( |
Expression Data
Expression Detail
Antibody Labeling
Phenotype Data
Phenotype Detail
Acknowledgments
This image is the copyrighted work of the attributed author or publisher, and
ZFIN has permission only to display this image to its users.
Additional permissions should be obtained from the applicable author or publisher of the image.
Full text @ Int. J. Mol. Sci.