FIGURE

Figure 8

ID
ZDB-FIG-241019-27
Publication
Silva et al., 2024 - Evaluation of the Effects of Diet-Induced Obesity in Zebrafish (Danio rerio): A Comparative Study
Other Figures
All Figure Page
Back to All Figure Page
Figure 8

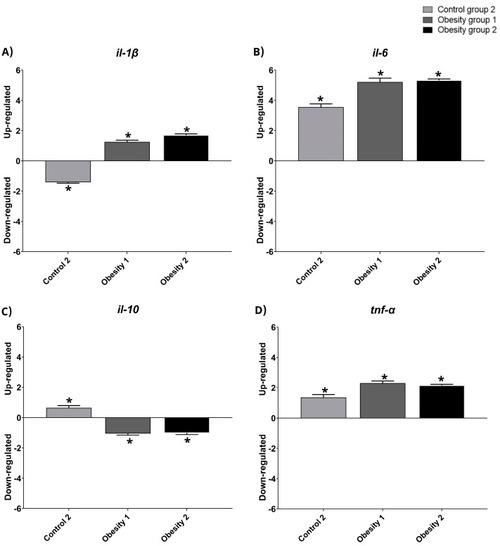
Relative gene expression values of inflammatory markers in visceral adipose tissue in adult male zebrafish (three months) with diet-induced obesity (DIO) for eight weeks. Qualitative data and normalization with control group 1. Control group 2: fed with commercial food (3.5% of the group’s average weight); obesity group 1: overfed with powdered egg yolk mixed with soybean oil (2.5:1 w/w)—5% of average body weight; obesity group 2—overfed with Artemia sp. in the first month (60 mg/day/fish) and in the second month (120 mg/day/fish). Asterisks indicate significant statistical differences. (A): il-1 β: interleukin 1 beta; (B): il-6: interleukin 6; (C): il-10: interleukin 10; (D): tnf-α: tumor necrosis factor alpha. Down-regulated: low gene expression. Up-regulated: high gene expression.

Expression Data

Expression Detail
Antibody Labeling
Phenotype Data

Phenotype Detail
Acknowledgments
This image is the copyrighted work of the attributed author or publisher, and ZFIN has permission only to display this image to its users. Additional permissions should be obtained from the applicable author or publisher of the image. Full text @ Nutrients