FIGURE

Figure 6

ID
ZDB-FIG-241019-25
Publication
Silva et al., 2024 - Evaluation of the Effects of Diet-Induced Obesity in Zebrafish (Danio rerio): A Comparative Study
Other Figures
All Figure Page
Back to All Figure Page
Figure 6

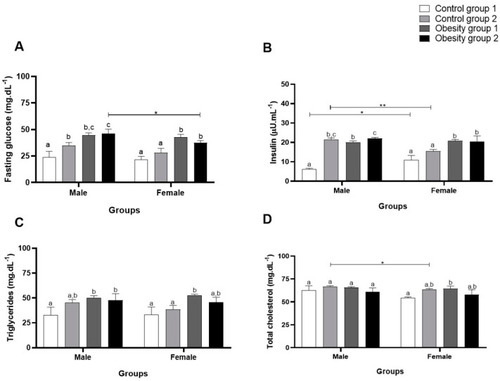
Concentrations of biochemical parameters of adult male and female zebrafish (three months) with diet-induced obesity (DIO) for eight weeks. Values are expressed as mean (standard deviation). n = 50 adult animals per group. Letters a, b and c represent statistical differences in the comparison between groups. Equal letters indicate no significant difference between the groups evaluated for each parameter. Asterisks: * p < 0.05; ** p < 0.001. Control group 1: fed with Artemia sp. (first month: 15 mg/day/fish and in the second month 30 mg/day/fish); control group 2: fed with commercial food (3.5% of the group’s average weight); obesity group 1: overfed with powdered egg yolk mixed with soybean oil (2.5:1 w/w)—5% of average body weight; obesity group 2—overfed with Artemia sp. in the first month (60 mg/day/fish) and in the second month (120 mg/day/fish). (A): results of Fasting glucose; (B): results of insulin; (C): results of triglycerides; (D): results of total cholesterol.

Expression Data

Expression Detail
Antibody Labeling
Phenotype Data

Phenotype Detail
Acknowledgments
This image is the copyrighted work of the attributed author or publisher, and ZFIN has permission only to display this image to its users. Additional permissions should be obtained from the applicable author or publisher of the image. Full text @ Nutrients