
Fig. 1
- ID
- ZDB-FIG-241009-25
- Publication
- Ketharnathan et al., 2024 - Loss of Dnajc21 leads to cytopenia and altered nucleotide metabolism in zebrafish
- Other Figures
- All Figure Page
- Back to All Figure Page
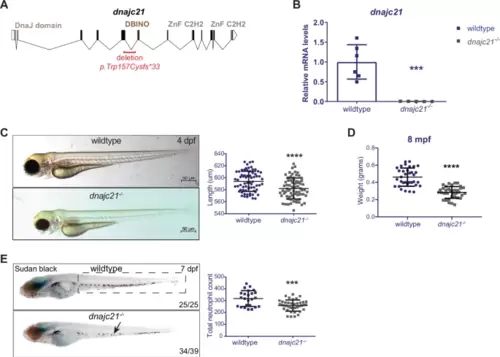
dnajc21-mutant zebrafish exhibit reduced growth and neutropenia.A Schematic of the zebrafish dnajc21 gene showing locations of the deletion and important functional domains. B qPCR analysis showing downregulation of dnajc21 mRNA in dnajc21−/− mutant embryos compared to wildtype at 48 hpf. Each datapoint represents RNA extracted from a pool of n = 30 larvae. b-actin and eef1a1l1 were used for normalization. C Brightfield lateral view images of dnajc21−/− mutant and wildtype larvae at 4 dpf. Graph shows quantification of larval length. Two biological replicates, each comprising 30–60 embryos per genotype, were analyzed. D Weight measurements of wildtype (n = 34) and dnajc21−/− (n = 36) fish at 8 mpf. E Lateral views of Sudan Black staining in dnajc21−/− mutant and wildtype larvae at 7 dpf. Arrow indicates reduced staining. Two biological replicates, each comprising 20 embryos per genotype, were analyzed. Numbers on the lower right indicate the number of larvae with the same phenotype. The black dotted box marks the region in the trunk used for counting. Number of neutrophils per embryo is quantified in the graph. hpf: hours post-fertilization; dpf: days post-fertilization; mpf: months post-fertilization ***p < 0.0001; ****p < 0.00001. |