FIGURE

Figure 2.

ID
ZDB-FIG-240926-17
Publication
Mukherjee et al., 2024 - The impact of predators and vegetation on shoaling in wild zebrafish
Other Figures
All Figure Page
Back to All Figure Page
Figure 2.

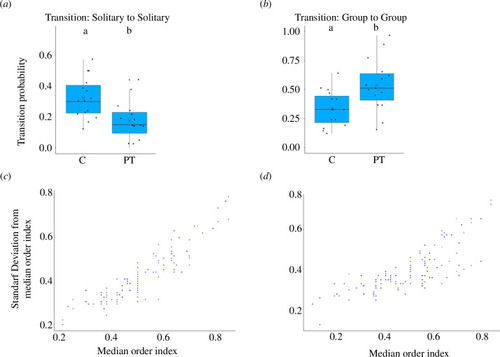
Shoal dynamics and deviation in individuals’ shoal position in control treatments and predator treatments. Box-and-whisker plots representing the probability of continuing to swim in: (a) solitary and (b) in group state for CT and PT. Each dot represents the mean probability of changing states by a unique group. The different letters (letters ‘a’ and ‘b’) placed above the boxes represent significant differences between the treatments. Comparisons were performed using Tukey’s HSD test (sample size: NC = NPT = 15 shoals; p < 0.05). Scatter plots representing the correlation between standard deviation from the median order index and the median order index in control treatments (c) and predator treatments (d). Each dot represents the median order index and the corresponding standard deviation from a median order index by an individual. The correlation was tested using Spearman’s correlation test (sample size: NC, NPT = 150 individuals; p < 0.05).

Expression Data

Expression Detail
Antibody Labeling
Phenotype Data

Phenotype Detail
Acknowledgments
This image is the copyrighted work of the attributed author or publisher, and ZFIN has permission only to display this image to its users. Additional permissions should be obtained from the applicable author or publisher of the image. Full text @ R Soc Open Sci