FIGURE

Figure 1.

ID
ZDB-FIG-240926-16
Publication
Mukherjee et al., 2024 - The impact of predators and vegetation on shoaling in wild zebrafish
Other Figures
All Figure Page
Back to All Figure Page
Figure 1.

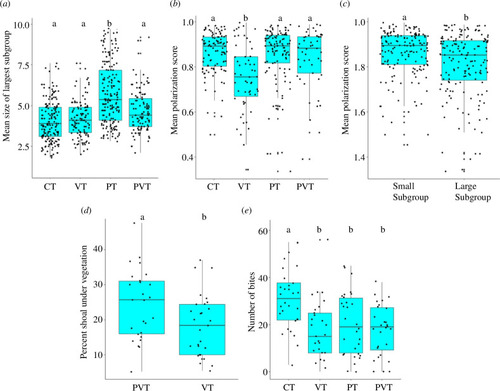
Box-and-whisker plots across treatments representing: (a) the mean size of largest subgroup, (b) the mean polarization score across treatments, (c) the mean polarization score across small and large subgroups, (d) the percent shoal under vegetation in the presence and absence of predator cues and (e) number of bites at worms. Each dot represents the average over one session of four sessions per group (a–c) or the average over all sessions (d) or the frequency of a unique group (e). The different letters (‘a’ and ‘b’) placed above the boxes represent significant differences between the treatments. The letters ‘ab’ indicate that the treatment is comparable to treatments ‘a’ and ‘b’. CT, control treatment; PT, predator treatment; PVT, predator vegetation treatment; VT, vegetation treatment. Comparisons were performed using Tukey’s HSD test (sample size: mean size of largest subgroup, mean polarization score: NCT = NPT = 45 shoals; NVT = NPVT = 30 shoals; p < 0.05).

Expression Data

Expression Detail
Antibody Labeling
Phenotype Data

Phenotype Detail
Acknowledgments
This image is the copyrighted work of the attributed author or publisher, and ZFIN has permission only to display this image to its users. Additional permissions should be obtained from the applicable author or publisher of the image. Full text @ R Soc Open Sci