
FIGURE
Fig. 3
Fig. 3
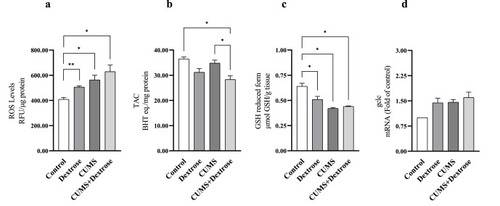
Effect of Dextrose, CUMS, and CUMS + Dextrose treatment on ROS content (a) and total antioxidant capacities (TAC) (b), GSH content (c), relative mRNA quantification of indicated gene: gclc (d). Nonparametric test was used for gclc mRNA content (panel d) statistical analysis. Data presented is the average of three determinations of different homogenates obtained from three-five pooled zebrafish brains. (*, p < 0.05; **, p < 0.01; ***, p < 0.001). Each value is represented as mean ± SEM (n = 3). |
Expression Data
Expression Detail
Antibody Labeling
Phenotype Data
Phenotype Detail
Acknowledgments
This image is the copyrighted work of the attributed author or publisher, and
ZFIN has permission only to display this image to its users.
Additional permissions should be obtained from the applicable author or publisher of the image.
Full text @ Arch. Biochem. Biophys.