Fig. 5
- ID
- ZDB-FIG-240808-24
- Publication
- Yuan et al., 2024 - Exome-wide association study identifies KDELR3 mutations in extreme myopia
- Other Figures
- All Figure Page
- Back to All Figure Page
|
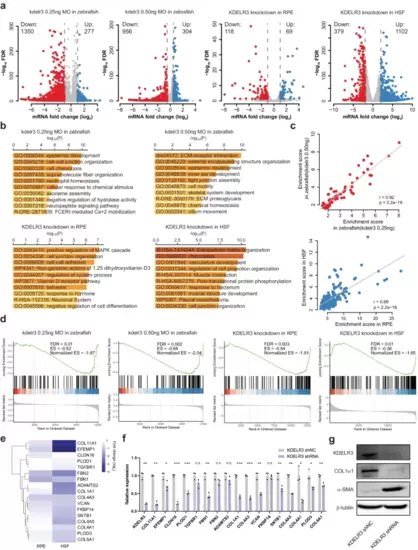
RNA-seq analysis of KDELR3-modulated genes. a A volcano plot illustrating differentially regulated gene expression from RNA-seq analysis between the control and KDELR3-deficient zebrafish eyeballs and human cell lines. Genes upregulated and downregulated are shown in red and blue, respectively. Values are presented as the log2 of fold change by DEseq2. b Top 10 Metascape clusters terms enriched for the downregulated targets in KDELR3-deficient transcriptome. The x-axis depicts -log (P-value). The p-value is defined as the probability of obtaining n or more pathway members, forming a cumulative hypergeometric distribution. c Gene ontology and pathway enrichment score are correlated for Metascape terms shared among downregulated genes of KDELR3-deficient zebrafish eyeballs and human cell lines. (Insert) Pearson correlation coefficients. d GSEA analysis for ECM organization in downregulated genes of KDELR3-deficient zebrafish eyeballs and human cell lines. normalized enrichment score (NES); false discovery rate-adjusted P-value (FDR). FDR derived from a GSEA analysis which uses a two-sided Kolmogorow–Smirnow test and performs multiple testing correction. e Heatmap of representative ECM organization-related genes. Each row represents the same gene in RPE and HSF cells. f qRT-PCR validation analysis shows the mRNA expression fold change of ECM organization-associated genes in the control vs KDELR3-deficient HSF cells. Each group has three biological replications. Data represent mean ± s.d. and P-value was generated by using two-sided Student’s t-test. *P < 0.05; **P < 0.01; ***P < 0.001. g Protein levels of scleral KDELR3, COL1α1, and α-SMA were detected by Western blot in KDELR3-deficient HSF. Source data are provided as a Source Data file. |

