
- Title
-
Exome-wide association study identifies KDELR3 mutations in extreme myopia
- Authors
- Yuan, J., Zhuang, Y.Y., Liu, X., Zhang, Y., Li, K., Chen, Z.J., Li, D., Chen, H., Liang, J., Yao, Y., Yu, X., Zhuo, R., Zhao, F., Zhou, X., Myopia Associated Genetics and Intervention Consortium, Yu, X., Qu, J., Su, J.
- Source
- Full text @ Nat. Commun.
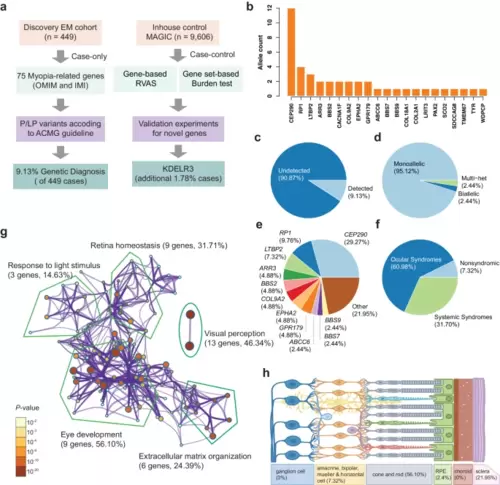
Study flowchart and overview of P/LP variants in known EM genes. a Flowchart for the study design to characterize and identify deleterious variants in known and unreported EM genes. A total of 449 EM patients were recruited for visual acuity, autorefraction testing, and whole-exome sequencing. b Allele counts of P/LP variants detected in 33 of 75 known EM genes. c Diagnostic yield of known EM-causing genes in 449 patients. d The proportion of each mode of inheritance in the 102 patients carrying P/LP variants in known EM genes. e The proportional contribution of each gene among 102 cases. f The proportion of patients classified according to the clinical syndromic information of the affected genes. g GO pathway enrichment for 33 known EM genes. This network shows the terms with a P-value < 0.01 identified by Metascape, a minimum gene count of 3, and an enrichment factor >1.5. The nodes sizes are scaled with a P-value. The known EM genes are most significantly enriched in visual perception, eye development, and extracellular matrix organization. The number in parentheses shows the gene number and proportional contribution of each gene. h Schematic overview of proportional contribution of retinal cell-specific genes. |
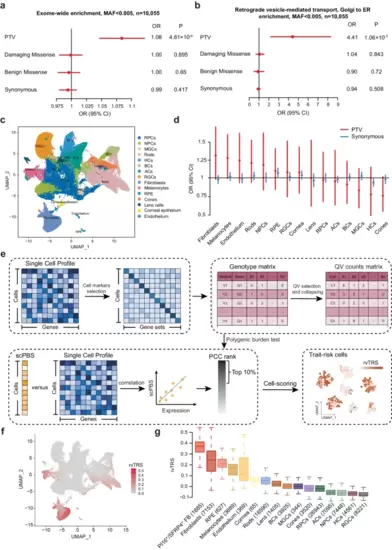
Exome-wide, gene set, and single-cell polygenic burden test of PTVs in EM cases.a Exome-wide burden analysis of PTVs, D-mis, B-mis, and synonymous variants within rare variants (MAF < 0.5%). Significance of association is displayed with the P-values from the two-sided Firth logistic regression test; errors bars indicated 95% confidence intervals (CIs) of the corresponding odds ratios. Multiple test correction P = 0.01. The graphs display the means and standard deviations. b Burden analysis of genes involved in retrograde vesicle-medicated transport, Golgi to ER. PTVs, D-mis, B-mis, and synonymous variants within rare variants are displayed. Significance of association is displayed with the P-values from the two-sided Firth logistic regression test; errors bars indicated 95% confidence intervals (CIs) of the corresponding odds ratios. Multiple test correction P = 0.01. c Uniform manifold approximation and projection (UMAP) embedding plot shows the cellular component of a scRNA-seq dataset for human embryonic eyes. RPCs retinal progenitor cells, NPCs neurogenic RPCs, MGCs Müller glial cells, HCs horizontal cells, BCs bipolar cells, ACs amacrine cells, RGCs retinal ganglion cells, RPE retinal pigment epithelia, Endothelium endothelial cells. d Burden analysis of genes highly expressed in each cell types (testing for enrichment in rare variants of the 10% most specific genes in cell type). PTVs and synonymous variants within rare variants are displayed. The sample size for EM is as follows: Ncases = 449, Ncontrols = 9,606. The black solid line represents the null (OR = 1). Each point shows the point estimate of OR from logistic regression. Bars show 95% confidence intervals (CI). e Overview of scPBS approach. scPBS takes a case-control genotype matrix and a scRNA-seq data set as input and outputs individual-cell-level polygenic burden score for association with the disease. f Per-cell rvTRS calculated by scPBS and Seurat for EM are shown in tSNE coordinates. g Per-cell types rvTRS. Boxplots show the median with interquartile range (IQR) (25%–75%); whiskers extend 1.53 the IQR. The number of cells in each cell types is shown in parentheses. Source data are provided as a Source Data file. |
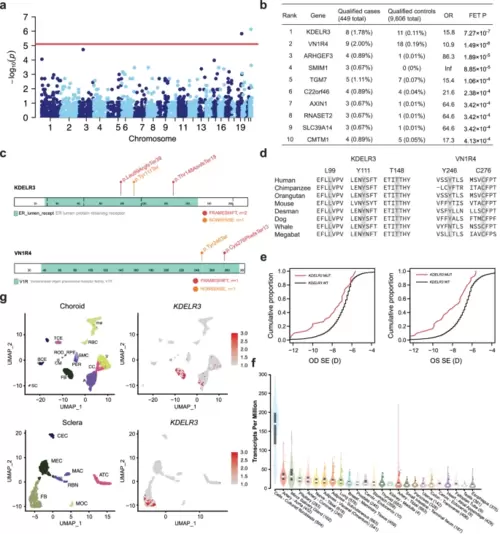
Collapsing analysis identifies KDELR3 as an EM gene. a Manhattan plots of the gene-based collapsing analysis. An excess of rare PTVs in EM cases within genes were tested using Fisher’s exact test [FET], Red line, P = 0.05/6335 = 7.89 × 10−06. b The top ten genes from collapsing analyses under the same model are shown, including the exact numbers of all qualifying cases and controls and statistical calculations of association (OR and FET P). c Linear schematic of the KDELR3 and VN1R4 encoded protein and location of genetic variants identified by WES. Frameshift variants are in red, Nonsense variants in orange. d Multiple sequence alignment indicating a degree of sequence conservation across species at the locations of KDELR3 and VN1R4 rare PTVs. e Cumulative distribution of SER in MAGIC cohort. The x-axis is the SER of right (OD) and left (OS) eyes. The y-axis is the cumulative fraction of individuals. red: individuals carrying KDELR3 PTVs, black: individuals without carrying KDELR3 PTVs. f Violin plots indicate the expression of KDELR3 genes retina and other tissues in GTEx. Sample size for each tissue is shown in parentheses. The center line in the box plots contained within each violin plot shows the median, the box edges depict the interquartile range (IQR), and whiskers mark 1.5× the IQR. The violin plot edges represent the minima and maxima values. g UMAP of all tissues single-cell data with cell colored based on the expression of KDELR3 genes for particular cell types. Gene expression levels are indicated by shades of red. SC Schwann cells, BCE B-cell, TCE T-cell, CM melanocytes, FB fibroblast, RPE retinal pigment epithelium, SMC smooth muscle cells, PER pericytes, RBC rod bipolar cells, ROD rods, mo macrophage, A artery, CC choriocapillaris, V vein, MOC monocytes, RBN retinal bipolar neuron, MEC melanocytes, MAC macrophage, ATC active T cells, CEC corneal epithelial cells. |

Characterization of kdelr3-deficient human and zebrafish. a SS-OCT images of right (OD) and left (OS) eyes for individuals with and without rare PTVs in KDLER3. b Quantification of eye measurement, retinal and choroidal thickness in normal eyes and EM eyes with KDELR3-deficient. P-value calculated by two-sided Wilcoxon rank sum test. c Quantification of eye axis length, the axis-to-body length ratio, lens diameter, and lens-to-body length ratio across various MO dose groups. Each group has more than five eyeballs. Data was analyzed by two-sided Student’s t-test, ∗P < 0.05, ∗∗P < 0.01, ∗∗∗P < 0.001 significantly different from control 0.5 ng group (n.s. non-significant differences). Boxplots display the median, quartiles, and variability of the data. d Immunohistochemistry of control-MO injected eyes and kdelr3-deficient morphants. e, Boxplots representing the normalized fluorescence intensity associated with various MO dose groups. Each group has more than ten eyeballs. Data was analyzed by two-sided Student’s t-test, *P < 0.05, **P < 0.01, ***P < 0.001 significantly different from control group (n.s. non-significant differences). Boxplots display the median, quartiles, and variability of the data. f VMR testing in kdelr3-deficient zebrafish morphants. Larvae injected with kdelr3-MO (0.35 ng) showed a weaker ON response and a significantly attenuated OFF response compared to control larvae. g The data in the Figure represent averages ± standard deviation of triplicate assays in one experiment. **P < 0.01, ***P < 0.001 (two-sided Student’s t-test). |
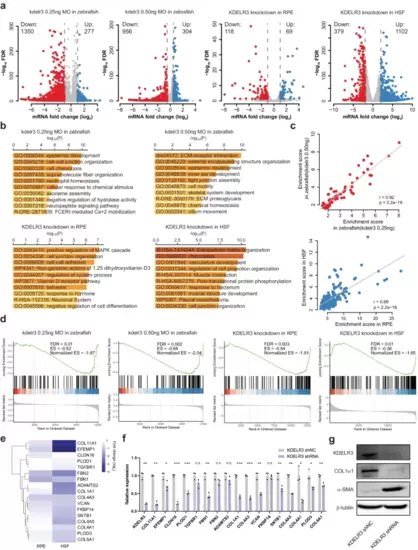
RNA-seq analysis of KDELR3-modulated genes. a A volcano plot illustrating differentially regulated gene expression from RNA-seq analysis between the control and KDELR3-deficient zebrafish eyeballs and human cell lines. Genes upregulated and downregulated are shown in red and blue, respectively. Values are presented as the log2 of fold change by DEseq2. b Top 10 Metascape clusters terms enriched for the downregulated targets in KDELR3-deficient transcriptome. The x-axis depicts -log (P-value). The p-value is defined as the probability of obtaining n or more pathway members, forming a cumulative hypergeometric distribution. c Gene ontology and pathway enrichment score are correlated for Metascape terms shared among downregulated genes of KDELR3-deficient zebrafish eyeballs and human cell lines. (Insert) Pearson correlation coefficients. d GSEA analysis for ECM organization in downregulated genes of KDELR3-deficient zebrafish eyeballs and human cell lines. normalized enrichment score (NES); false discovery rate-adjusted P-value (FDR). FDR derived from a GSEA analysis which uses a two-sided Kolmogorow–Smirnow test and performs multiple testing correction. e Heatmap of representative ECM organization-related genes. Each row represents the same gene in RPE and HSF cells. f qRT-PCR validation analysis shows the mRNA expression fold change of ECM organization-associated genes in the control vs KDELR3-deficient HSF cells. Each group has three biological replications. Data represent mean ± s.d. and P-value was generated by using two-sided Student’s t-test. *P < 0.05; **P < 0.01; ***P < 0.001. g Protein levels of scleral KDELR3, COL1α1, and α-SMA were detected by Western blot in KDELR3-deficient HSF. Source data are provided as a Source Data file. |