
FIGURE
Fig. 8
- ID
- ZDB-FIG-240722-73
- Publication
- Kisla et al., 2024 - Synthesis and Structure of Novel Phenothiazine Derivatives, and Compound Prioritization via In Silico Target Search and Screening for Cytotoxic and Cholinesterase Modulatory Activities in Liver Cancer Cells and In Vivo in Zebrafish
- Other Figures
- All Figure Page
- Back to All Figure Page
Fig. 8
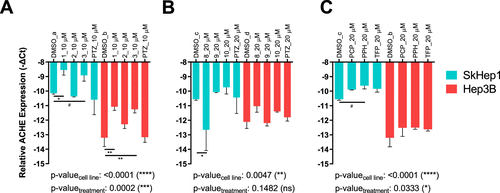
Expression of ACHE in SkHep1 and Hep3B cells, respectively, after treatment with (A) 1, 2, 3, PTZ at 10 μM; (B) 8, 9, 10, PTZ at 20 μM; and (C) PCP, PPH, TFP at 20 μM for 24 h. While the y-axis shows relative ACHE expression to TPT1 reference gene as─DeltaCt, two-way ANOVA followed by Sidak’s test was used to compare each treatment group to a batch and cell-line specific DMSO control group, indicated as DMSO_a–d. Main group tests are reported on graphs as cell line and treatment-specific p-values (*: p ≤ 0.05, **: p ≤ 0.01, ***: p ≤ 0.001, ****: p ≤ 0.0001, and #: p ≤ 0.1). |
Expression Data
Expression Detail
Antibody Labeling
Phenotype Data
Phenotype Detail
Acknowledgments
This image is the copyrighted work of the attributed author or publisher, and
ZFIN has permission only to display this image to its users.
Additional permissions should be obtained from the applicable author or publisher of the image.
Full text @ ACS Omega