
Fig. 7
- ID
- ZDB-FIG-240701-24
- Publication
- Liu et al., 2024 - BF170 hydrochloride enhances the emergence of hematopoietic stem and progenitor cells
- Other Figures
- All Figure Page
- Back to All Figure Page
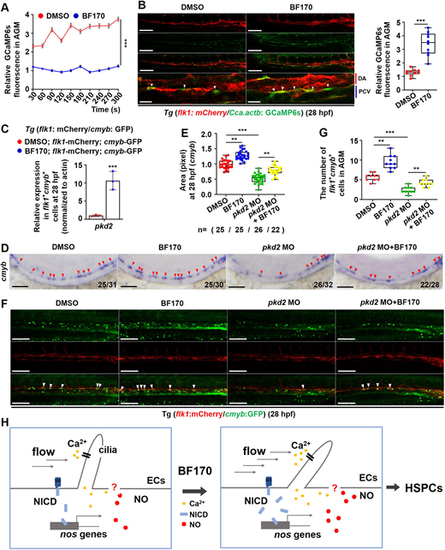
Ca2+ signaling mediates the effects of BF170 on hematopoietic stem and progenitor cell induction. (A) Calculation of GCaMP6s fluorescence signaling in the aorta-gonad-mesonephros (AGM) region in Tg (flk1: mCherry/Cca.actb: GCaMP6s) zebrafish embryos at 28 hpf. (B) Increased GCaMP6s fluorescence in the AGM region in Tg (flk1: mCherry/Cca.actb: GCaMP6s) embryos treated with BF170 [white arrowheads indicate the Ca2+ signaling in endothelial cells of the dorsal aorta (DA)]. The images on the bottom row are higher magnifications of the panels above. Box and whisker plot shows quantification of Ca2+ signaling in endothelial cells of the DA in the AGM region. (C) Increased pkd2 expression in flk1+cmyb+ double-positive cells in BF170-treated embryos. (D) Knockdown of pkd2 blocked the BF170-induced increased expression of cmyb in the zebrafish embryos at 28 hpf (red arrowheads indicate positive signals). (E) Quantification of the whole-mount in situ hybridization data. (F) Knockdown of pkd2 blocked the increased number of flk1+cmyb+ cells induced by BF170 (white arrowheads indicate double-positive cells). (G) Quantification of flk1+cmyb+ cells in F. (H) Working model for how BF170 induces hematopoietic stem and progenitor cell (HSPC) emergence. In BF170-treated embryos, endothelial cilia first sense the change of fluid shear stress generated by increased blood flow induced by BF170, then induce downstream Ca2+, followed by Notch signaling and NO production. This facilitates HSPC emergence. Images are lateral views with anterior to the left and dorsal upwards. In D, Nchanged/Ntotal in the bottom right corner of each image indicates embryos with changed expression/total tested embryos. n values indicate the number of embryos with changed expression in each group. Each experiment was repeated three times. Data are mean±s.d. In the box and whisker plots, the boxes indicate the mean and min to max values, and the whiskers indicate s.d.**P<0.01, ***P<0.001. Scale bars: 100 μm in B (20 μm in higher magnifications); 100 μm in D,E. |