
Fig. 3
- ID
- ZDB-FIG-240619-3
- Publication
- Morooka et al., 2024 - Angpt1 binding to Tie1 regulates the signaling required for lymphatic vessel development in zebrafish
- Other Figures
- All Figure Page
- Back to All Figure Page
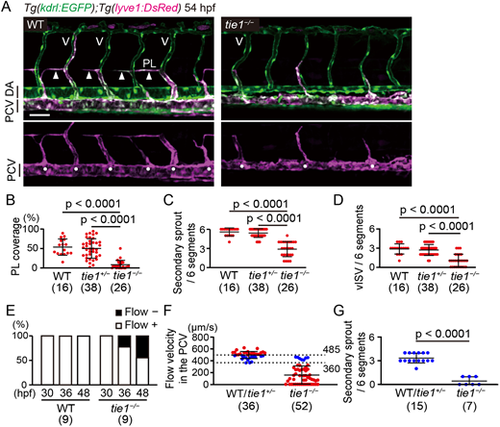
tie1 mutants exhibit defects in secondary sprouting from the posterior cardinal vein (PCV). (A) Trunk of Tg(kdrl:EGFP);Tg(lyve1:DsRed) WT and tie1−/− embryos (54 hpf). Formation of secondary sprouts (solid circles), PLs (arrowheads) and venous ISVs (V) were inhibited in tie1−/− embryos. (B) Percentage of PL coverage at 54 hpf. Data are mean±s.d. (WT, n=16 embryos; tie1+/−, n=38 embryos; tie1−/−, n=26 embryos). (C) Number of secondary sprouts scored across six segments at 54 hpf. Data are mean±s.d. (WT, n=16 embryos; tie1+/−, n=38 embryos; tie1−/−, n=26 embryos). (D) Number of vISVs scored across six segments at 54 hpf. Data are mean±s.d. (WT, n=16 embryos; tie1+/−, n=38 embryos; tie1−/−, n=26 embryos). (E) Percentage of WT and tie1−/− embryos with (+) and without (−) blood flow at 30, 36 and 48 hpf. The blood flow in tie1 mutants was gradually decreased during and after secondary sprouting (WT, n=9 embryos; tie1−/−, n=9 embryos). (F) Flow velocities in the PCV of Tg(kdrl:EGFP);Tg(lyve1:DsRed) WT/tie1+/− and tie1−/− embryos (45-46 hpf). Flow velocities were measured by tracking polyethylene glycol-coated fluorescent microspheres (PEG-coated FMs) injected intravascularly (see Movie 3). tie1−/− embryos showing normal flow velocities (360-485 µm/s) comparable to WT and tie1+/− siblings are indicated by blue dots and analyzed in G. Data are mean±s.d. (WT/tie1+/−, n=36 embryos; tie1−/−, n=52 embryos). (G) Number of secondary sprouts scored across six segments in WT/tie1+/− and tie1−/− embryos (45-46 hpf) at flow velocities between 360 µm/s and 485 µm/s, indicated as blue dots in F. Representative images and movie are shown in Fig. S6C and Movie 3, respectively. Data are mean±s.d. (WT/tie1+/−, n=15 embryos; tie1−/−, n=7 embryos). Scale bar: 50 μm. P-values were determined by one-way ANOVA with Tukey's test (B-D) and by two-tailed Student's t-test (G). PL, parachordal lymphangioblast. |