
Fig. 3
- ID
- ZDB-FIG-240606-3
- Publication
- Mishra et al., 2024 - SUDAZFLNC - a curated and searchable online database for zebrafish lncRNAs, mRNAs, miRNAs, and circadian expression profiles
- Other Figures
- All Figure Page
- Back to All Figure Page
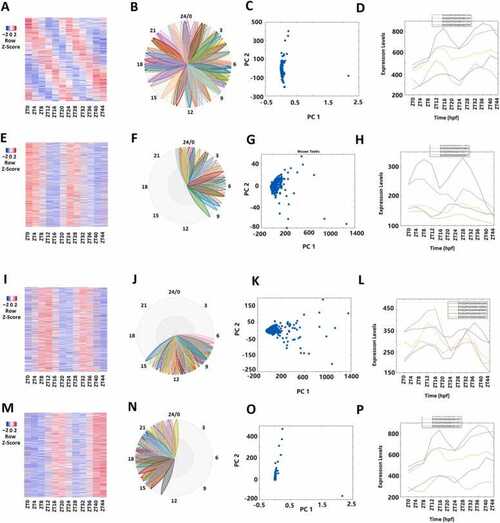
Analyses of 4047 rhythmically expressed zebrafish mRNAs. (A-D) Analysis of all the 4047 rhythmically expressed zebrafish mRNAs: Heat map (A) of all the 4047 rhythmically expressed mRNAs, BioDare2 phase plots of all mRNAs (B), PCA analyses of all mRNAs with variances of PC1 99.56% and PC2 0.19% (C), and expression profiles of the representative mRNAs (D). (E-H) Analysis of 1817 morning mRNAs: Heat map of the 1817 morning mRNAs (E), BioDare2 phase plots of morning mRNAs (F), PCA analyses of the morning mRNAs with variances of PC1 97.82% and PC2 1.04% (G), and expression profiles of the representative mRNAs (H). (I-L) Heat map of the 1128 evening mRNAs (I), BioDare2 phase plots of evening mRNAs (J), PCA analyses of the evening mRNAs with variances of PC1 97.18% and PC2 1.75% (K), and expression profiles of the representative mRNAs (L). (M-P) Heat map of the 1426 night mRNAs (M), BioDare2 phase plots of the night mRNAs (N), PCA analyses of the night mRNAs with variances of PC1 99.82% and PC2 0.13% (O), and expression profiles of the representative mRNAs (P). |