Fig. 5
- ID
- ZDB-FIG-240513-5
- Publication
- Osman et al., 2024 - Non-invasive single cell aptasensing in live cells and animals
- Other Figures
- All Figure Page
- Back to All Figure Page
|
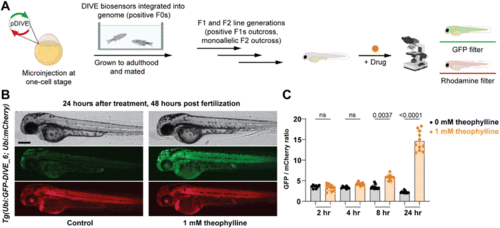
Non-invasive imaging of drug uptake in new transgenic DIVE expressing zebrafish line. (A) Workflow for generating DIVE aptasensor-expressing transgenic zebrafish Tg(Ubi:GFP-DIVE_6; Ubi:mCherry). Embryos from an F2 outcross were bathed in 1 mM theophylline beginning at 24 hpf. (B) Representative brightfield and fluorescent micrographs from 48 hpf embryos containing the integrated biosensor plasmid (Ubi:GFP-DIVE_6; Ubi:mCherry). Zebrafish orientation is lateral view, anterior left. Scale bar: 250 μm. (C) Quantification of pixel intensity of GFP and mCherry was calculated for the trunk of the zebrafish and the GFP/mCherry ratio plotted. The average GFP/mCherry ratio ± s.d. with values for individual fish shown. p values from a Kruskal–Wallis analysis of variance with post-hoc Dunn's test. |

