
Fig. 4
- ID
- ZDB-FIG-240513-33
- Publication
- Morocho-Jaramillo et al., 2024 - The zebrafish heart harbors a thermogenic beige fat depot analog of human epicardial adipose tissue
- Other Figures
- All Figure Page
- Back to All Figure Page
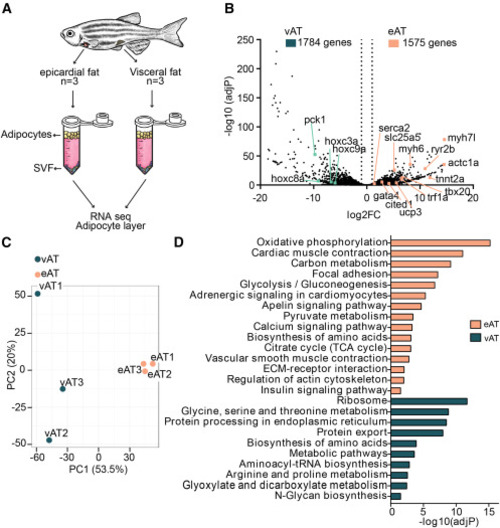
RNA-seq of adipocytes isolated from eAT and vAT reveals markedly different genome-wide expression profiles between the fat depots (A) Schematic of the bulk RNA-seq approach for isolated adipocytes. SVF, stromal vascular fraction. (B) Volcano plot displaying differentially expressed genes in eAT compared with vAT. The x axis shows fold change on a log2 scale and the y axis adjusted p value on a −log10 scale. A total of 1,575 genes were upregulated in zebrafish eAT and 1,784 genes in the vAT. (C) Principal-component analysis (PCA) score plot showing clustering of adipocytes based on tissue type. (D) KEGG enrichment pathways from differentially expressed genes in the eAT versus vAT, expressed as the −log10[P] adjusted for multiple comparisons. Data were obtained from 3 animals per group. |