
Fig. 2
- ID
- ZDB-FIG-240513-31
- Publication
- Morocho-Jaramillo et al., 2024 - The zebrafish heart harbors a thermogenic beige fat depot analog of human epicardial adipose tissue
- Other Figures
- All Figure Page
- Back to All Figure Page
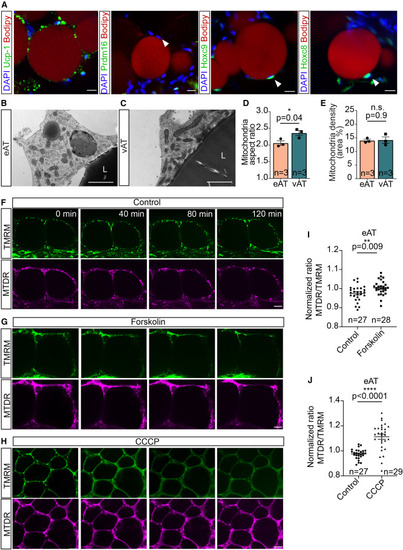
Zebrafish eAT possesses molecular signatures, subcellular morphology, and thermogenic capability typical of beige adipocytes (A) Confocal images of zebrafish hearts immunostained for the brown/beige markers Ucp1 and Prdm16 or the white adipocyte markers Hoxc8 and Hoxc9 and stained with BODIPY 558/568 C12 and DAPI. Arrowheads indicate adipocyte nuclei. Scale bar, 10 μm. (B–E) Electron microscopy images depicting round and fragmented mitochondria in zebrafish eAT (B) compared with the elongated and tubular morphology common in adipocytes from visceral adipose tissue (vAT) (C). L, lipid droplet. Scale bar, 1 μm. A bar graphs show the mitochondrial aspect ratio in eAT and vAT (D) and mitochondrial density (per cytoplasmic area of individual cells) in eAT and vAT (E). (F–J) Forskolin induces thermogenesis in the eAT. (F–H) Still images captured from time-lapse imaging of explanted hearts show changes of fluorescence intensity in epicardial adipocytes, co-stained with MitoTracker Deep Red (MTDR) and tetra-methyl rhodamine methyl ester (TMRM), following vehicle (F), forskolin (G), or carbonylcyanide-3-chlorophenylhydrazone (CCCP) (H) treatment. Scale bars, 20 μm. (I and J) Scatterplots showing increased thermal ratios (MTDR/TMRM) of epicardial adipocytes, stimulated by forskolin (I) or CCCP (J), compared with vehicle treatment. Data in (D), (E), (I), and (J) are presented as mean ± SEM. n.s., not significant. ∗p < 0.05, ∗∗p < 0.01, ∗∗∗p < 0.001, two-tailed t test. n indicates number of animals (D and E) and number of adipocytes obtained from three fish per condition (I and J). |