
Fig. 5
- ID
- ZDB-FIG-240510-39
- Publication
- Ou et al., 2024 - Formation of different polyploids through disrupting meiotic crossover frequencies based on cntd1 knockout in zebrafish
- Other Figures
- All Figure Page
- Back to All Figure Page
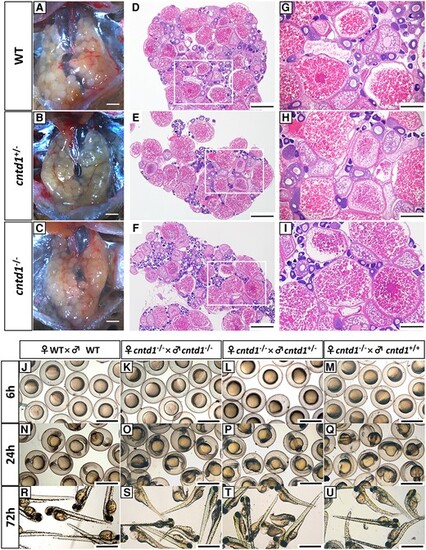
Observations of ovarian development and reproduction. A–C, Anatomical views of the ovaries from wild-type (WT) (A), cntd1+/− (B), and cntd1−/− (C) females, with each group consisting of three individuals. The scale bar in A–C represents 1 mm. D–I, Histological observations of the ovaries from WT (D and G), cntd1+/− (E and H), and cntd1−/− (F and I) females. Both a holistic view (D–F) and a magnified view (G–I) of the ovarian section are provided. White boxes highlight the magnified areas. Scale bars in D–F and G–I represent 0.5 and 200 μm, respectively. J–M, Embryos obtained from self-crossing of WT zebrafish (J) and cntd1−/− females crossed with cntd1−/− (K), cntd1+/− (L), and cntd1+/+ (M) males at 6 h postfertilization (hpf). N–Q, Embryos obtained from self-crossing of WT zebrafish (N) and cntd1−/− females crossed with cntd1−/− (O), cntd1+/− (P), and cntd1+/+ (Q) males at 24 hpf. R–U, Embryos obtained from self-crossing of WT zebrafish (R) and cntd1−/− females crossed with cntd1−/− (S), cntd1+/− (T), and cntd1+/+ (U) males at 72 hpf. The scale bar in J–U represents 1 mm. |