
Fig. 4
- ID
- ZDB-FIG-240510-38
- Publication
- Ou et al., 2024 - Formation of different polyploids through disrupting meiotic crossover frequencies based on cntd1 knockout in zebrafish
- Other Figures
- All Figure Page
- Back to All Figure Page
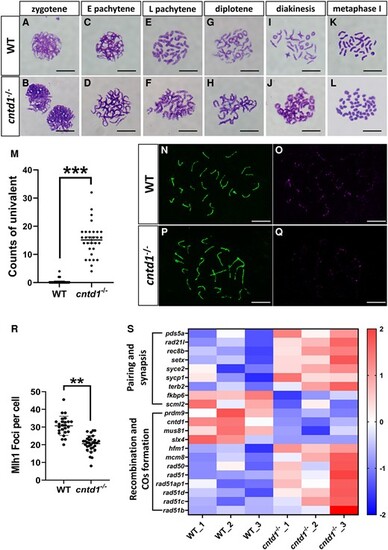
Observations of meiotic chromosome behavior during spermatogenesis. A and B, Spermatocytes at the zygotene stage in wild-type (WT) (A) and cntd1−/− (B) zebrafish. C and D, Spermatocytes at the early pachytene stage in WT (C) and cntd1−/− (D) zebrafish with “E” indicating “early.” E and F, Spermatocytes at the late pachytene stage in WT (E) and cntd1−/− (F) zebrafish with “L” indicating “late.” G and H, Spermatocytes at the diplotene stage in WT (G) and cntd1−/− (H) zebrafish. I and J, Spermatocytes at the diakinesis stage in WT (I) and cntd1−/− (J) zebrafish. K and L, Spermatocytes at the metaphase I stage in WT (K) and cntd1−/− (L) zebrafish. The scale bar in A–L represents 10 μm. (M) Statistical analysis of univalent at the metaphase I stage in WT and cntd1−/− zebrafish. For this analysis, two testes isolated from the WT and cntd1−/− males were collected as one sample, and three such samples were used. (N and O) Immunofluorescent staining of WT zebrafish spermatocytes with antibodies against Sycp3 (N) and Mlh1 (O). P and Q, Immunofluorescent staining of cntd1−/− zebrafish spermatocytes with antibodies against Sycp3 (P) and Mlh1 (Q). The scale bar in N–Q represents 10 μm. R, Statistical analysis of Mlh1 signals in WT and cntd1−/− zebrafish, with two testes collected as one sample and three such samples used for the analysis. (S) Hierarchical clustering of meiosis-related genes based on transcriptome analysis. The error bars represent the means ± standard deviations (SDs); “**” and “***” above the error bar indicate statistically significant differences at 0.001 < P < 0.01 and P < 0.001, respectively, as determined by a two-tailed Student's t-test. |