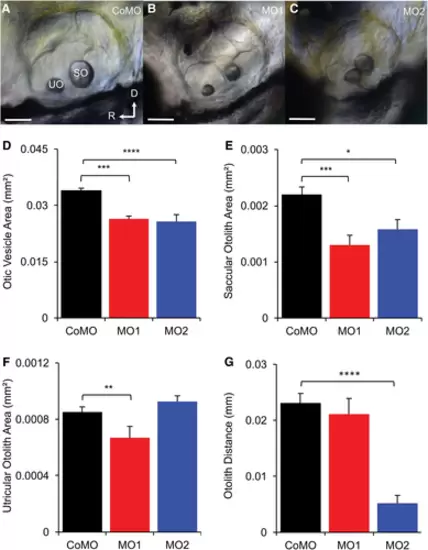
Phenotypes of MO1 and MO2 morphants compared with CoMO fish. (A, B, C) Lateral views of otic vesicles of CoMO, MO1, and MO2 fish at 3 dpf, showing abnormal morphology of otic vesicles of MO1 and MO2 morphants. SO, saccular otolith; UO, utricular otolith; D, dorsal; and R, rostral. Scale bars = 50 μm. (D) Comparison of otic vesicle areas among MO1, MO2, and CoMO fish, showing significantly smaller otic vesicles for both MO1 and MO2 morphants than CoMO fish. (E) Comparison of saccular otolith areas among CoMO, MO1, and MO2 morphants, showing significantly smaller SO for MO1 and MO2 than CoMO morphants. (F) Comparison of utricular otolith areas among CoMO, MO1, and MO2 morphants, showing smaller UO areas for MO1 than CoMO morphants but no size difference between MO2 and CoMO fish. (G) Comparison of otolith distances among MO1, MO2, and CoMO fish, showing shortened otolith distance for MO2 but normal otolith distance for MO1 morphants. In D–G, Values are presented as means + SEM; NCoMO = NMO1 = NMO2 = 10, *P < 0.05, ANOVA, and post hoc Tukey tests, **P < 0.01, ***P < 0.005, ****P < 0.001.
|

